このページは機械翻訳を使用して翻訳されました。最新版の英語を参照するには、ここをクリックします。
LEOメガコンステレーションのNTNカバレッジと容量を解析
この例では、衛星ベースの非地上ネットワーク (NTN) アプリケーション用の低軌道 (LEO) 衛星のメガコンステレーションの人口密度が非常に低い地域のカバレッジと容量を解析する方法を示します。カバレッジ解析には以下が含まれます。
地域内の全ユーザーの衛星可視性の割合
地域内のすべてのユーザーにおけるリンク可用性の割合
しきい値を超える容量を持つユーザーの割合
この例では以下を前提としています。
すべての衛星リンクは再生可能です。
各衛星は、他のすべての可視衛星と通信できます。
シミュレーションの設定
この例では、送信機としてLEO衛星のコンスタレーションと、関心領域 (ROI) 内の受信機として複数のユーザー機器 (UE) を使用して、S バンド周波数で動作するサービス リンクをモデル化します。この例では、Hexa-X D5.3成果物[1]で定義されているNTNシミュレーション設定を使用します。
衛星シナリオの作成
satelliteScenario オブジェクトを使用して衛星シナリオを作成します。シナリオの開始時間、終了時間、サンプル時間を指定します。衛星の高度に基づいて停止時間とサンプル時間を選択し、地球の周りを衛星が 1 周する範囲を解析します。この例では、高度1325 km のLEO衛星の回転期間をカバーするために 2 時間の停止時間を使用します。
sc = satelliteScenario;
sc.StartTime = datetime(2024,4,29,09,01,57); % In datetime
sc.StopTime = sc.StartTime + hours(2);       % In datetime
sc.SampleTime = 60;                          % In s
LEO 衛星コンステレーションを指定する
LEO衛星のコンスタレーションの構成を定義します。各コンスタレーションは複数の軌道シェルで構成されます。軌道殻は、地球を取り囲む特定のレイヤーを表し、高度と傾斜角、軌道の数、および各軌道内の衛星の数によって定義されます。Aerospace Toolbox ライセンスをお持ちの場合は、walkerStar (Aerospace Toolbox) 関数を使用して衛星のシェルを作成することもできます。この例では、3 つの衛星群を使用し、各衛星群を個別のエンティティとして扱い、それぞれに対して解析を実行します。この例では、Hexa-X D5.3成果物表4-1 [1]で指定されたパラメータを使用し、シェルパラメータはLEO 衛星コンステレーションのTelesatシステムに対応しています[2]。
% Define the satellite constellations.
% All these fields must have same number of entries: ShellNames,
% ShellAltitude, ShellInclination, NumOrbits, and NumSatellitesPerOrbit
constellation = struct;
constellation(1).Name = "Constellation 1";
constellation(1).ShellNames = ["Altitude 1", "Altitude 2"];
constellation(1).ShellAltitude = [1015 1325];              % In km
constellation(1).ShellInclination = [98.98 50.88];         % In degrees
constellation(1).NumOrbits = [3 6];                        % Number of orbital planes
constellation(1).NumSatellitesPerOrbit = [5 5];            % Number of satellites per orbital plane

constellation(2).Name = "Constellation 2";
constellation(2).ShellNames = ["Altitude 1", "Altitude 2"];
constellation(2).ShellAltitude = [1015 1325];              % In km
constellation(2).ShellInclination = [98.98 50.88];         % In degrees
constellation(2).NumOrbits = [6 20];                       % Number of orbital planes
constellation(2).NumSatellitesPerOrbit = [13 11];          % Number of satellites per orbital plane

constellation(3).Name = "Constellation 3";
constellation(3).ShellNames = ["Altitude 1", "Altitude 2"];
constellation(3).ShellAltitude = [1015 1325];              % In km
constellation(3).ShellInclination = [98.98 50.88];         % In degrees
constellation(3).NumOrbits = [12 20];                      % Number of orbital planes
constellation(3).NumSatellitesPerOrbit = [13 22];          % Number of satellites per orbital plane

% Validate dimensions of each constellation
validateConstellation(constellation)
すべての衛星の送信機パラメーターを指定します。この例では、送信機に等方性アンテナを使用して、すべての衛星を同じ送信機構成で操作します。
txConfig = struct;
txConfig.Frequency = 2e9;  % Carrier frequency in Hz
txConfig.Power = 20;       % Transmitter power in dBW
txConfig.BitRate = 10;     % Bit rate in Mbps
txConfig.SystemLoss = 0;   % Transmitter system loss in dB
txConfig.Bandwidth = 10e6; % Link bandwidth in Hz
ROI内のユーザー機器を指定する
緯度と経度の制限を指定して、関心領域 (ROI) を定義します。この ROI に展開される UE の数を指定します。これらの UE は、ROI 内のカバレッジ メトリックを計算するための概念的な参照として機能します。この例では、地上局をUE として使用し、すべての地上局を同じ受信機構成で操作します。各地上局に等方性アンテナが装備されていると仮定します。この例では、北米とアフリカの一部を含む北大西洋の地域に 50 人のユーザーを展開します。
lat = [20 70];     % Limits of latitude in degrees ([min max])
lon = [-90 20];    % Limits of longitude in degrees ([min max])
numUEs = 50;       % Number of UE
minElevAngle = 30; % Minimum elevation angle in degrees
すべての地上局の受信機パラメーターを指定します。
rxConfig = struct;
rxConfig.MaxGByT = -5;        % Maximum gain-to-noise-temperature in dB/K
rxConfig.SystemLoss = 0;      % Receiver system loss in dB
rxConfig.PreReceiverLoss = 0; % Pre-receiver loss in dB
rxConfig.RequiredEbNo = 11;   % Required bit energy to noise power spectral density ratio in dB
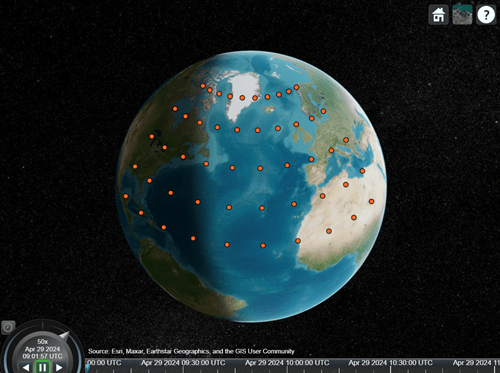
衛星シナリオでROIを表示
meshgrid を使用して、指定された緯度と経度の制限をカバーする領域を見つけます。領域内の等間隔の座標点(度単位)を見つけて、地上局を配置します。衛星シナリオを使用して ROI 内の地上局を表示します。
% Find the coordinates of uniformly spaced UEs within the ROI
[latSpacing,lonSpacing] = findClosestFactors(numUEs);
latPts = linspace(lat(1),lat(2),latSpacing);
lonPts = linspace(lon(1),lon(2),lonSpacing);
[latMesh,lonMesh] = meshgrid(latPts,lonPts);
latCoord = latMesh(:);
lonCoord = lonMesh(:);

% Add the ground station to the scenario
ue = groundStation(sc,latCoord,lonCoord);
[ue.MinElevationAngle] = minElevAngle;

% Add the receive antenna to the ground station
isotropic = arrayConfig(Size=[1 1]);
rx = receiver(ue,Antenna=isotropic, ...
    SystemLoss=rxConfig.SystemLoss, ...
    PreReceiverLoss=rxConfig.PreReceiverLoss, ...
    GainToNoiseTemperatureRatio=rxConfig.MaxGByT);

% Show the ROI
s = satelliteScenarioViewer(sc,ShowDetails=false);
カバレッジメトリックを計算する
指定された 3 つのコンスタレーションのカバレッジ メトリックを計算します。各コンスタレーションで、指定された軌道シェルに衛星を追加し、指定された構成の送信機を衛星に追加し、各 UE に対して次の手順を実行します。
仰角を使用して UE から見える衛星を見つけます。
シミュレーション期間全体にわたって、すべての可視衛星の UE への一時リンクを作成します。
ebnoを使用して、すべてのリンクの UE での受信ビット エネルギーとノイズ電力スペクトル密度比 (Eb/No) を計算します。各時間インスタンスにおける最大 Eb/No を UE に保存します。
各時間インスタンスにおける UE の最大搬送波対雑音比 (CNR) を計算します。
シャノンの定理を使用して、最大 CNR と帯域幅に対して可能な最大リンク容量を計算します。
% Delete viewer to avoid animating all the constellation and temporary
% links
delete(s)

% For each timestamp and each UE, find the maximum signal power
timeSteps = sc.StartTime:seconds(sc.SampleTime):sc.StopTime;
numTimeSteps = numel(timeSteps);
% Store the results in an output structure
resultPerConstellation = struct("SatelliteVisibility",[], ...
    "LinkAvailability",[], ...
    "MinLinkAvailability",[], ...
    "MinSatelliteVisibility",[], ...
    "MaxEbNo",[], ...
    "MaxCNR",[], ...
    "Capacity",[], ...
    "NumTotalSatellites",[]);
results = repmat(resultPerConstellation,numel(constellation),1);

% Loop each constellation
for constIdx = 1:numel(constellation)
    % Display status message at the start of processing loop
    fprintf("Computing coverage statistics for constellation " + constIdx)

    % Initialize the variables
    [linkAvailability,satelliteVisibility, ...
       maxEbNo] = deal(zeros(numUEs,numTimeSteps));

    % Add satellites to the scenario
    sat = addSatellites(sc,constellation(constIdx));
    % Add transmitter to the satellites
    tx = transmitter(sat, ...
        Frequency=txConfig.Frequency, ...
        Power=txConfig.Power, ...
        SystemLoss=txConfig.SystemLoss, ...
        BitRate=txConfig.BitRate, ...
        Antenna=arrayConfig(Size=[1 1]));

    for ueIdx = 1:numUEs
        % Display progress through dots in intervals of 20%
        if mod(ueIdx,ceil(0.2*numUEs)) == 0
            fprintf(".")
        end

        % Find the elevation angle of all the satellites with respect to
        % UE
        [~,el] = aer(ue(ueIdx),sat);
        % Find the satellites that have elevation angles greater than or equal
        % to minimum elevation angle
        elIdx = el >= ue(ueIdx).MinElevationAngle;
        % Satellite visibility: Set to 1 when a satellite is visible to the
        % UE
        satelliteVisibility(ueIdx,:) = any(elIdx,1);
        % Create temporary links for all the satellites that are visible over
        % the simulation duration
        validTx = tx(any(elIdx,2));
        if ~isempty(validTx)
            links = link(validTx,rx(ueIdx));
            % Calculate the received Eb/No
            ebByNo = ebno(links);
            % Get the maximum Eb/No when link is closed
            maxEbNo(ueIdx,:) = max(ebByNo);
            % Link Availability: Set to 1 when the link is closed
            linkAvailability(ueIdx,:) = any(linkStatus(links));
            % Delete links
            delete(links)
        end
    end

    % Compute the max CNR based on max Eb/No
    cno = maxEbNo + pow2db(tx(1).BitRate) + 60;  % Bit rate is in Mbps
    cnrdB = cno - pow2db(txConfig.Bandwidth);
    cnr = db2pow(cnrdB);
    % Compute capacity using Shannon theorem, only for available links
    capacity = txConfig.Bandwidth*log2(1+cnr); % bps

    % Capture the results to the output structure
    results(constIdx).SatelliteVisibility = satelliteVisibility;
    results(constIdx).MinSatelliteVisibility = min(mean(satelliteVisibility,2));
    results(constIdx).LinkAvailability = linkAvailability;
    results(constIdx).MinLinkAvailability = min(mean(linkAvailability,2));
    results(constIdx).MaxEbNo = maxEbNo;
    results(constIdx).MaxCNR = cnr;
    results(constIdx).Capacity = capacity;
    results(constIdx).NumTotalSatellites = numel(sat);

    % Delete the satellites
    delete(sat)

    % Display status message at end of processing loop
    fprintf(newline + "Computed coverage statistics for constellation " + constIdx + newline)
end
Computing coverage statistics for constellation 1
.....
Computed coverage statistics for constellation 1
Computing coverage statistics for constellation 2
.....
Computed coverage statistics for constellation 2
Computing coverage statistics for constellation 3
.....
Computed coverage statistics for constellation 3
衛星の可視性、リンク可用性、およびしきい値を超える容量を持つ UE の確率という 3 つのカバレッジ メトリックを計算します。
衛星可視性
UE の衛星可視性は、可視衛星が存在する時間インスタンスの数と時間インスタンスの合計数の比率として定義されます。ある地域における衛星の可視性は、そのエリア内のすべての UE の中で最も低い可視性レベルによって決まります。地域全体の衛星可視性の値が x の場合、地域内のすべての UE が少なくとも x パーセントの時間、衛星可視性を持っていることを意味します。
satelliteVisibility = [results.MinSatelliteVisibility]'*100; % Value in percentageリンク可用性
UE のリンク可用性は、非負のリンク マージンを持つ時間インスタンスの数と時間インスタンスの合計数の比率として定義されます。地域を越えたリンクの可用性は、そのエリア内のすべての UE の中で最も低い可用性レベルによって決まります。領域全体のリンク可用性の値が x の場合、領域内のすべての UE が少なくとも x パーセントの時間有効な通信リンクを持っていることを意味します。
linkAvailability = [results.MinLinkAvailability]'*100; % Value in percentageしきい値を超える容量を持つUEの確率
特定の時間にしきい値を超える容量を持つ UE の確率は、そのしきい値を超える容量を持つ UE の数と UE の総数の比率として定義されます。シミュレーション時間中にしきい値を超える容量を持つ UE の確率は、すべての時間インスタンスにわたってしきい値を超える容量を持つ UE の確率の平均です。確率の値が x の場合、すべてのエントリにわたって、平均して x パーセントのユーザーがしきい値を超える容量を持っていることを意味します。この例では、しきい値として 1 Mbps を使用します。
coveragePercent = zeros(numel(results),1);
threshold = 1;                                                 % In Mbps
for i = 1:numel(results)
    cTemp = results(i).Capacity;
    coveragePercent(i) = mean(cTemp > threshold*1e6,[1 2])*100;
end
結果の可視化
カバレッジ メトリックを表にまとめます。
numTotalSatellites = [results.NumTotalSatellites];
constellationNames = [constellation.Name];
resultTable = table(constellationNames',numTotalSatellites',satelliteVisibility,linkAvailability,coveragePercent, ...
    VariableNames={'Constellation Name','Num. Satellites','Satellite Visibility (%)','Link Availability (%)', ...
    ['Capacity > ',num2str(threshold),' Mbps (%x)']})
resultTable=3×5 table
    Constellation Name    Num. Satellites    Satellite Visibility (%)    Link Availability (%)    Capacity > 1 Mbps (%x)
    __________________    _______________    ________________________    _____________________    ______________________

    "Constellation 1"            45                   9.0909                    3.3058                    36.893
    "Constellation 2"           298                   73.554                    63.636                    94.893
    "Constellation 3"           596                   99.174                    97.521                    99.983
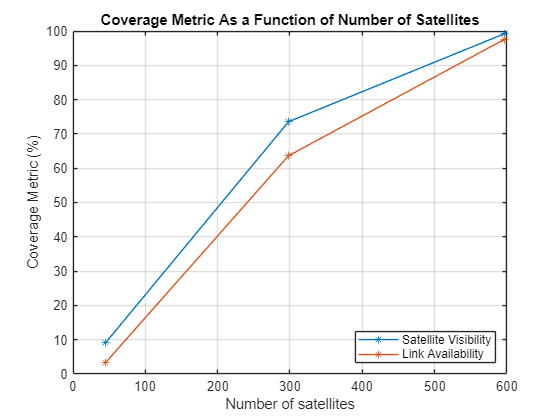
衛星の可視性とリンク可用性をプロットします。
figure(1)
% Plot the percentage of satellite visibility of the region for the whole
% simulation duration
plot(numTotalSatellites,satelliteVisibility,"-*")
grid on
box on
xlabel("Number of satellites")
ylabel("Coverage Metric (%)")
hold on
% Plot the percentage of link availability of the region for the whole
% simulation duration
plot(numTotalSatellites,linkAvailability,"-*")
% Add legend to the plot
legend("Satellite Visibility","Link Availability", ...
    Location="southeast")
hold off
title("Coverage Metric As a Function of Number of Satellites")
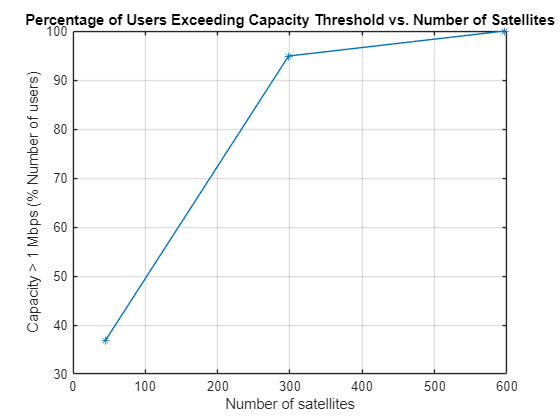
領域内の UE の平均数に基づいて、リンクが利用可能な場合は常に、シミュレーション時間全体にわたってしきい値を超える容量を持つ UE の割合をプロットします。
figure(2)
plot(numTotalSatellites,coveragePercent,"-*")
grid on
box on
xlabel("Number of satellites")
ylabel("Capacity > " + num2str(threshold) + " Mbps (% Number of users)")
title("Percentage of Users Exceeding Capacity Threshold vs. Number of Satellites")
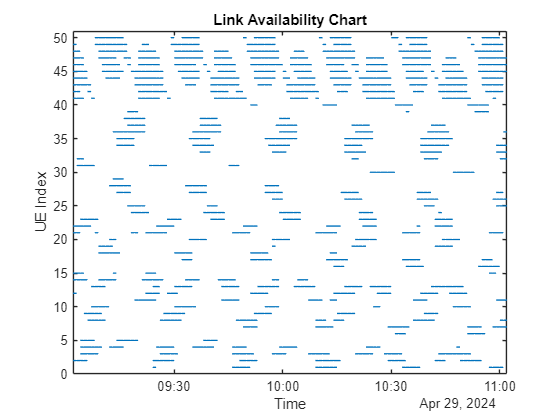
最初に指定されたコンスタレーションのすべてのタイムスタンプにわたって各 UE のリンク可用性チャートをプロットします。
figure(3)
% Scale the status with the UE number for better visualization
colors = colororder;
firstLineColor = colors(1,:);
ueIndex = (1:numUEs)';
linkAvailabilityFirstConst = results(1).LinkAvailability;
linkAvailabilityFirstConst(linkAvailabilityFirstConst == 0) = nan;
plot(timeSteps,linkAvailabilityFirstConst.*ueIndex, ...
    Color=firstLineColor,LineWidth=1)
xlim([timeSteps(1) timeSteps(end)])
ylim([0 numUEs+1])
xlabel("Time")
ylabel("UE Index")
title("Link Availability Chart")
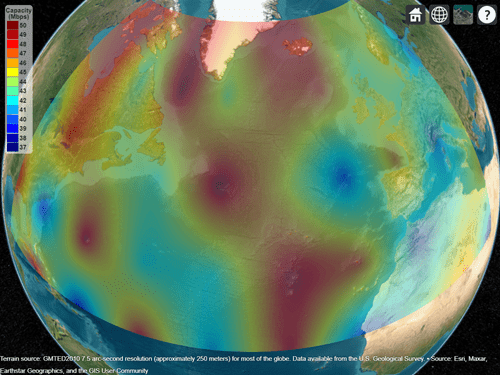
RF 伝播解析と可視化をサポートする siteviewer の停止時間における 3 番目の指定されたコンスタレーションの地域カバレッジをプロットします。
capacityLastInstance = results(end).Capacity(:,end)./1e6;                % In Mbps
% Launch siteviewer for each example run to plot the capacity
siteviewer;
pd = propagationData(latCoord,lonCoord,"Capacity",capacityLastInstance);
legendTitle = "Capacity" + newline + "(Mbps)";
contour(pd,LegendTitle=legendTitle)
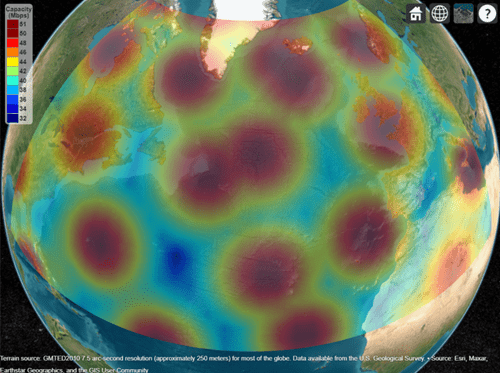
プロットした地域カバレッジを次の図と比較します。この図は、デフォルトのパラメーター設定を使用して地域内で 1000 台の UE を実行して得られた、停止時間における 3 番目に指定されたコンステレーションの地域コンスタレーションを示しています。地域内に多数の UE が存在するため、カバレッジ結果はエリア全体でより優れた解像度を示します。
その他の調査
特定の領域に対するカバレッジ解析を使用すると、この例を次のように拡張できます。
異なる軌道パラメーターを持つ衛星コンスタレーションを比較します。
狭帯域 IoT (NB-IoT) や 5G new radioなどの標準ベースのシステムの CNR とスループットをマッピングします。
ROI 内の UE の数を増やすことで、地域内のユーザー密度が高い場合の影響を解析します。
送信機と受信機で Antenna Toolbox ™ と Phased Array System Toolbox ™ の異なるアンテナを使用して、アンテナ パターンの影響をモデル化します。
NTN に限定されない他の衛星ベースのアプリケーションの範囲と容量を解析します。
参考文献
[1] Hexa-X.最終6Gアーキテクチャイネーブラーと技術的ソリューション。成果物 D5.3。編集はマーテン・エリクソン、ハンヌ・フリンク、パナギオティス・ヴラチェアス、ステファン・ヴェンシュテット。ヘキサ-X、2023年4月30日。
[2] パクラー、ニルス、イニゴ・デル・ポルティージョ、エドワード・F・クローリー、ブルース・G・キャメロン「グローバルブロードバンドを提供するための4つの低軌道衛星コンスタレーションシステムの最新比較」2021 IEEE国際通信会議ワークショップ(ICCワークショップ)、1~7、2021年。https://doi.org/10.1109/ICCWorkshops50388.2021.9473799。
ローカル関数
function [factor1,factor2] = findClosestFactors(n)
% This function finds the two factors of n that are closest to each other

% Initialize the factors from 1 and n
factor1 = 1;
factor2 = n;

% Loop through possible factors up to the square root of n
for i = round(sqrt(n)):-1:1
    if mod(n,i) == 0  % If i is a factor
        factor1 = i;
        factor2 = n/i;
        break % Exit the loop as you find the closest factors
    end
end

end

function sat = addSatellites(sc,const)
% Add the satellites to the scenario with the input constellation

sat = [];
for i = 1:numel(const.ShellAltitude)
    % Get orbital elements for each satellite in the shell
    [semimajoraxis,eccentricity, ...
        inclination,RAAN,argofperiapsis, ...
        trueanomaly,numTotSat] = getOrbitalElements(const.ShellAltitude(i),const.ShellInclination(i), ...
        const.NumOrbits(i),const.NumSatellitesPerOrbit(i));

    % Add satellites to the scenario
    satellitesOrbit = satellite(sc, ...
        semimajoraxis,eccentricity,inclination,RAAN,argofperiapsis,trueanomaly, ...
        Name=(const.Name + " " + const.ShellNames(i) + " " + string(1:numTotSat)'));

    % Output the satellite objects
    sat = [sat(:); satellitesOrbit(:)];
end

end

function [semimajoraxis,eccentricity, ...
    inclination,RAAN,argofperiapsis, ...
    trueanomaly,numTotSat] = getOrbitalElements(shellAltitude,shellInclination, ...
    numOrbits,numSatellitesPerPlane)
% Get the orbital elements based on the shell altitude, shell inclination,
% number of orbits and number of satellites per orbital plane

% Number of satellites in the constellation
numTotSat = numOrbits*numSatellitesPerPlane;

% Get orbital elements
orbitIdx = repelem(1:numOrbits,1,numSatellitesPerPlane);
planeIdx = repmat(1:numSatellitesPerPlane,1,numOrbits);
RAAN = 180*(orbitIdx-1)/numOrbits;
trueanomaly = 360*(planeIdx-1 + 0.5*(mod(orbitIdx,2)-1)) ...
    /numSatellitesPerPlane;
semimajoraxis = repmat((6371 + shellAltitude)*1e3,1,numTotSat); % meters
inclination = repmat(shellInclination,1,numTotSat);             % degrees
eccentricity = zeros(1,numTotSat);                              % degrees
argofperiapsis = zeros(1,numTotSat);                            % degrees

end

function validateConstellation(constellation)
% Validates the dimensions of all fields in each constellation

for constIdx = 1:numel(constellation)
    validateattributes(constellation(constIdx).Name,["char","string"],"scalartext")
    numShellName = numel(constellation(constIdx).ShellNames);
    validateattributes(constellation(constIdx).ShellNames,"string","nonempty")
    validateattributes(constellation(constIdx).ShellAltitude,"double", ...
        {'positive','integer','numel',numShellName})
    validateattributes(constellation(constIdx).ShellInclination,"double", ...
        {'numel',numShellName})
    validateattributes(constellation(constIdx).NumOrbits,"double", ...
        {'positive','integer','numel',numShellName})
    validateattributes(constellation(constIdx).NumSatellitesPerOrbit,"double", ...
        {'positive','integer','numel',numShellName})
end

end
参考
オブジェクト
関数
ebno|satellite|groundStation|link|transmitter|receiver