addCursor
Add cursor to polar plot angle
Description
id = addCursor(___) returns
a cell array with one ID for each cursor created. You can specify
any of the arguments from the previous syntaxes.
Examples
Create a cosine antenna and plot the polar pattern of its directivity at 75 MHz. Then add cursors at two 150° and 270°.
cosineantenna = phased.CosineAntennaElement('FrequencyRange',[1.0e0 100.0e9],...
    'CosinePower',[2,2]);
p = pattern(cosineantenna,75.0e6,[-90:90],0,'Type','Directivity');
P = polarpattern([-90:90],p);
addCursor(P,[45 135]);

Create a cosine antenna and plot the polar pattern of its directivity at 75 MHz. Then create an isotropic antenna. Also calculate the directivity of this antenna at 75 MHz. Add the directivity plot of the isotropic antenna to the directivity plot of the cosine antenna. Then add cursors at several points.
cosineantenna = phased.CosineAntennaElement('FrequencyRange',[1.0e0 100.0e9],...
    'CosinePower',[2,2]);
p1 = pattern(cosineantenna,75.0e6,[-90:90],0,'Type','Directivity');
P = polarpattern([-90:90],p1);
isoantenna = phased.IsotropicAntennaElement('FrequencyRange',...
    [1.0e0 100.0e9]);
p2 = pattern(isoantenna,75.0e6,[-180:180],0,'Type','Directivity');
add(P,[-180:180],p2);
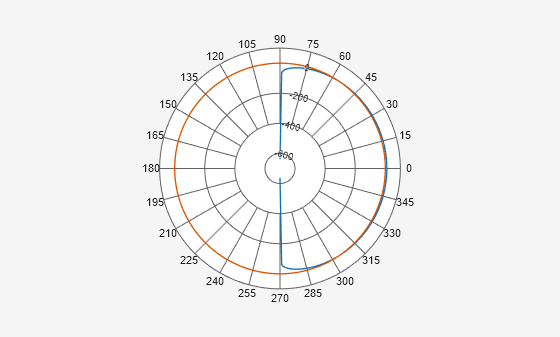
Add a cursor at approximately 30° to the cosine antenna pattern (designated by index 1) and at 150° and 270° to the isotropic polar pattern (designated by index 2).
addCursor(P,[30.5 149.0 314.7],[1 2 1]);

Input Arguments
Version History
Introduced in R2016a
See Also
add | animate | createLabels | findLobes | replace | showPeaksTable | showSpan