showPeaksTable
Show or hide peak marker table
Syntax
Description
Examples
Create a 15-element ULA of cosine antennas with elements spaced one-half wavelength apart. Then, plot the directivity of the array at 20 GHz.
fc = 20.0e9;
c = physconst('Lightspeed');
lam = c/fc;
angs = [-180:1:180];
antenna = phased.CosineAntennaElement('FrequencyRange',[1.0e9,100.0e9],...
    'CosinePower',[2.5 2.5]);
array = phased.ULA('Element',antenna,'NumElements',15,'ElementSpacing',lam/2);
Plot the polar pattern and show three peaks of the antenna. When creating a polarpattern plot, if you specify the Peaks property, the peaks table is displayed by default.
a = pattern(array,fc,angs,0);
P = polarpattern(angs,a,'Peaks',3);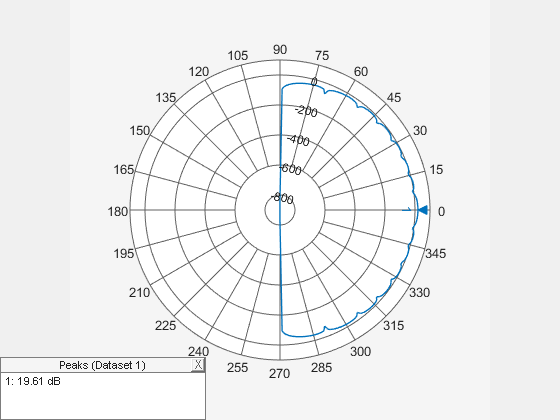
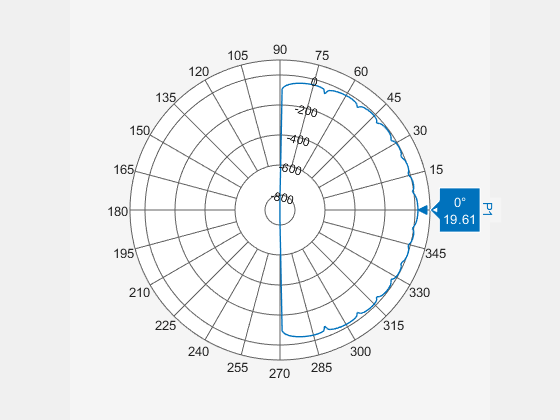
Hide the table. When the peaks table is hidden, the peak markers display the peak values.
showPeaksTable(P,0);
Input Arguments
Version History
Introduced in R2016a