phased.StretchProcessor
Stretch processor for linear FM waveform
Description
The phased.StretchProcessor object performs stretch processing on a linear FM
waveform.
To perform stretch processing:
Create the
phased.StretchProcessorobject and set its properties.Call the object with arguments, as if it were a function.
To learn more about how System objects work, see What Are System Objects?
Creation
Description
stretchproc = phased.StretchProcessor creates a stretch
processor System object™, stretchproc. The object performs stretch
processing on data from a linear FM waveform.
stretchproc = phased.StretchProcessor(Name = Value)stretchproc, with
additional options specified by one or more Name = Value
pair arguments. You can specify several name-value pair arguments in any order
as Name1 = Value1,…,NameN = ValueN.
Properties
Usage
Description
Input Arguments
Output Arguments
Object Functions
To use an object function, specify the
System object as the first input argument. For
example, to release system resources of a System object named obj, use
this syntax:
release(obj)
Examples
Use stretch processing to locate a target at a range of 4950 m. First, simulate a LinearFMWaveform.
waveform = phased.LinearFMWaveform;
x = waveform();
c = physconst("LightSpeed");
rng = 4950.0;
num_samples = round(rng/(c/(2*waveform.SampleRate)));
x = circshift(x,num_samples);
Perform stretch processing.
stretchproc = phased.StretchProcessor(...
    SampleRate = waveform.SampleRate, ...
    ReferenceRange = 5000,RangeSpan = 200, ...
    PropagationSpeed = c);
y = stretchproc(x);
Plot the spectrum of the resulting signal.
[Pxx,F] = periodogram(y,[],2048,stretchproc.SampleRate,"centered");
plot(F/1000,10*log10(Pxx))
grid
xlabel("Frequency (kHz)")
ylabel("Power/Frequency (dB/Hz)")
title("Periodogram Power Spectrum Density Estimate")
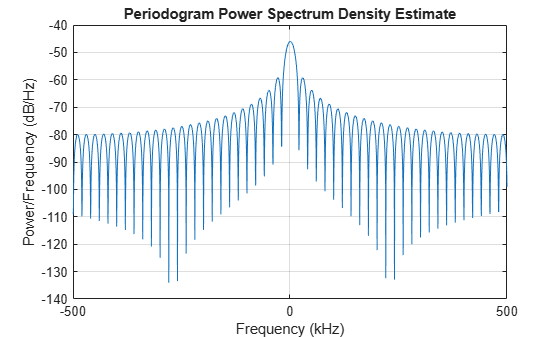
Detect the range.
[~,rngidx] = findpeaks(pow2db(Pxx/max(Pxx)), ...
    MinPeakHeight = -5);
rngfreq = F(rngidx);
rng = stretchfreq2rng(rngfreq, ...
    stretchproc.SweepSlope, ...
    stretchproc.ReferenceRange,c)
rng =
4.9634e+03
Use the getStretchProcessing object function to locate a target at a range of 4950 m. First, simulate the signal.
waveform = phased.LinearFMWaveform;
x = waveform();
c = physconst("LightSpeed");
rng = 4950.0;
num_samples = round(rng/(c/(2*waveform.SampleRate)));
x = circshift(x,num_samples);
Perform stretch processing.
stretchproc = getStretchProcessor(waveform,5000,200,c);
y = stretchproc(x);
Plot the spectrum of the resulting signal.
[Pxx,F] = periodogram(y,[],2048,stretchproc.SampleRate,"centered");
plot(F/1000,10*log10(Pxx))
grid
xlabel("Frequency (kHz)")
ylabel("Power/Frequency (dB/Hz)")
title("Periodogram Power Spectrum Density Estimate")
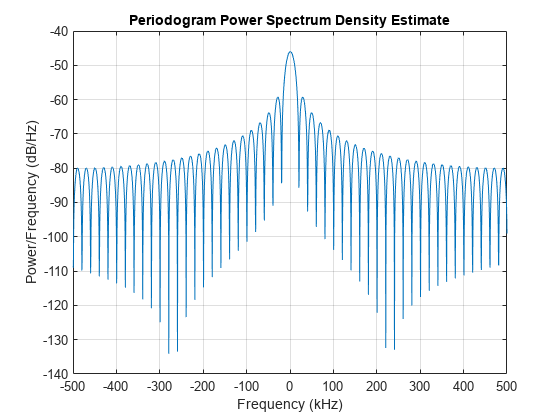
Detect the range.
[~,rngidx] = findpeaks(pow2db(Pxx/max(Pxx)), ...
    MinPeakHeight = -5);
rngfreq = F(rngidx);
rng = stretchfreq2rng(rngfreq, ...
    stretchproc.SweepSlope, ...
    stretchproc.ReferenceRange,c)
rng =
4.9634e+03
Algorithms
References
[1] Richards, M. A. Fundamentals of Radar Signal Processing. New York: McGraw-Hill, 2005.
Extended Capabilities
Version History
Introduced in R2012a