Main Content

gccphat

Generalized cross-correlation

Description

example

tau = gccphat(sig,refsig) computes the time delay, tau, between the signal, sig, and a reference signal, refsig. Both sig and refsig can have multiple channels. The function assumes that the signal and reference signal come from a single source. To estimate the delay, gccphat finds the location of the peak of the cross-correlation between sig and refsig. The cross-correlation is computed using the generalized cross-correlation phase transform (GCC-PHAT) algorithm. Time delays are multiples of the sample interval corresponding to the default sampling frequency of one hertz.

example

tau = gccphat(sig,refsig,fs), specifies the sampling frequency of the signal. Time delays are multiples of the sample interval corresponding to the sampling frequency. All input signals should have the same sample rate.

example

[tau,R,lag] = gccphat(___) returns, in addition, the cross-correlation values and correlation time lags, using any of the arguments from previous syntaxes. The lags are multiples of the sampling interval. The number of cross-correlation channels equals the number of channels in sig.

example

[___] = gccphat(sig) or [___] = gccphat(sig,fs) returns the estimated delays and cross correlations between all pairs of channels in sig. If sig has M columns, the resulting tau and R have M2 columns. In these syntaxes, no reference signal input is used. The first M columns of tau and R contain the delays and cross correlations that use the first channel as the reference. The second M columns contain the delays and cross-correlations that use the second channel as the reference, and so on.

Examples

collapse all

Load a gong sound signal. First, use the gong signal as a reference signal. Then, duplicate the signal twice, introducing time delays of 5 and 25 seconds. Leave the sampling rate to its default of one hertz. Use gccphat to estimate the time delays between the delayed signals and the reference signal.

load gong;
refsig = y;
delay1 = 5;
delay2 = 25;
sig1 = delayseq(refsig,delay1);
sig2 = delayseq(refsig,delay2);
tau_est = gccphat([sig1,sig2],refsig)
tau_est = 1×2

     5    25

Load a gong sound signal. Use the gong signal as a reference signal. Then, duplicate the signal, introducing a time delays of 5 milliseconds. Use the sampling rate of 8192 Hz. Use gccphat to estimate the time delay between the delayed signal and the reference signal.

load gong;
delay = 0.005;
refsig = y;
sig = delayseq(refsig,delay,Fs);
tau_est = gccphat(sig,refsig,Fs)
tau_est = 0.0050

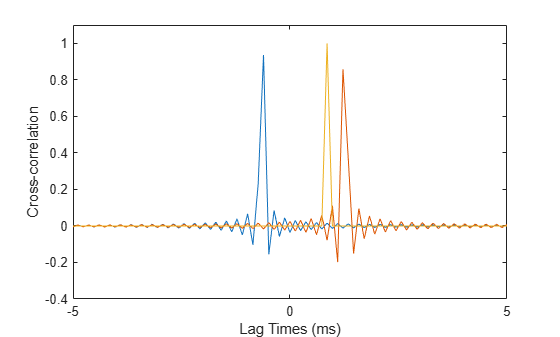
Load a musical sound signal with a sample rate is 8192 hertz. Then, duplicate the signal three times and introduce time delays between the signals. Estimate the time delays between the delayed signals and the reference signals. Plot the correlation values.

load handel;
dt = 1/Fs;
refsig = y;

Create three delayed versions of the signal.

delay1 = -5.2*dt;
delay2 = 10.3*dt;
delay3 = 7*dt;
sig1 = delayseq(refsig,delay1,Fs);
sig2 = delayseq(refsig,delay2,Fs);
sig3 = delayseq(refsig,delay3,Fs);

Cross-correlate the delayed signals with the reference signal.

[tau_est,R,lags] = gccphat([sig1,sig2,sig3],refsig,Fs);

The gccphat functions estimates the delay to the nearest sample interval.

disp(tau_est*Fs)
    -5    10     7

Plot the correlation functions.

plot(1000*lags,real(R(:,1)))
xlabel('Lag Times (ms)')
ylabel('Cross-correlation')
axis([-5,5,-.4,1.1])
hold on
plot(1000*lags,real(R(:,2)))
plot(1000*lags,real(R(:,3)))
hold off

Figure contains an axes object. The axes object with xlabel Lag Times (ms), ylabel Cross-correlation contains 3 objects of type line.

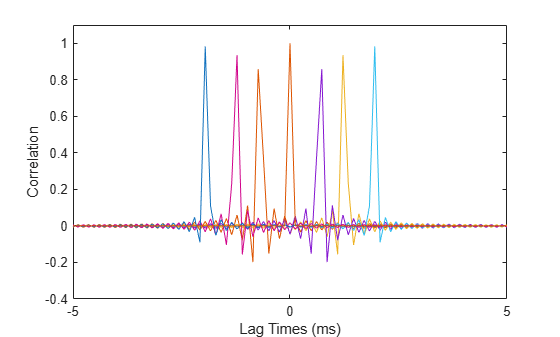
Load a musical sound signal with a sample rate is 8192 hertz. Then, duplicate the signal two times and introduce time delays between the two signals and the reference signal. Estimate the time delays and plot the cross-correlation function between all pairs of signals.

load handel;
dt = 1/Fs;
refsig = y;

Create three delayed versions of the signal.

delay1 = -5.7*dt;
delay2 = 10.2*dt;
sig1 = delayseq(refsig,delay1,Fs);
sig2 = delayseq(refsig,delay2,Fs);

Cross-correlate all signals with the other signal.

[tau_est,R,lags] = gccphat([refsig,sig1,sig2],Fs);

Show the time delays in units of sample interval. The algorithm estimates time delays quantized to the nearest sample interval. Cross-correlation of three signals produce 9 possible time delays, one for each possible signal pair.

disp(tau_est*Fs)
     0    -6    10     6     0    16   -10   -16     0

A signal correlated with itself gives zero lag.

Plot the correlation functions.

for n=1:9
    plot(1000*lags,real(R(:,n)))
    if n==1
        hold on
        xlabel('Lag Times (ms)')
        ylabel('Correlation')
        axis([-5,5,-.4,1.1])
    end
end
hold off

Figure contains an axes object. The axes object with xlabel Lag Times (ms), ylabel Correlation contains 9 objects of type line.

Input Arguments

collapse all

Sensor signals, specified as an N-by-1 column vector or an N-by-M matrix. N is the number of time samples and M is the number of channels. If sig is a matrix, each column is a different channel.

Example: [0,1,2,3,2,1,0]

Data Types: single | double
Complex Number Support: Yes

Reference signals, specified as an N-by-1 complex-valued column vector or an N-by-M complex-valued matrix. If refsig is a column vector, then all channels in sig use refsig as the reference signal when computing the cross-correlation.

If refsig is a matrix, then the size of refsig must match the size of sig. The gccphat function computes the cross-correlation between corresponding channels in sig and refsig. The signals can come from different sources.

Example: [1,2,3,2,1,0,0]

Data Types: single | double
Complex Number Support: Yes

Signal sample rate, specified as a positive real-valued scalar. All signals should have the same sample rate. Sample rate units are in hertz.

Example: 8000

Data Types: single | double
Complex Number Support: Yes

Output Arguments

collapse all

Time delay, returned as a 1-by-K real-valued row vector. The value of K depends upon the input argument syntax.

  • When a reference signal, refsig, is used, the value of K equals the column dimension of sig, M. Each entry in tau specifies the estimated delay for the corresponding signal pairs in sig and refsig.

  • When no reference signal is used, the value of K equals the square of the column dimension of sig, M2. Each entry in tau specifies the estimated delay for the corresponding signal pairs in sig.

Units are seconds.

Cross-correlation between signals at different sensors, returned as a (2N-1)-by-K complex-valued matrix.

  • When a reference signal, refsig, is used, the value of K equals the column dimension of sig, M. Each column is the cross-correlation between the corresponding signal pairs in sig and refsig.

  • When no reference signal is used, the value of K equals the square of the column dimension of sig, M2. Each column is the cross-correlation between the corresponding signal pairs in sig.

Correlation lag times, returned as a (2N-1) real-valued column vector. Each row of lag contains the lag time for the corresponding row of R. Lag values are constrained to be multiples of the sampling interval. Lag units are in seconds.

More About

collapse all

Generalized Cross-Correlation

You can use generalized cross-correlation to estimate the time difference of arrival of a signal at two different sensors.

A model of a signal emitted by a source and received at two sensors is given by:

r1(t)=s(t)+n1(t)r2(t)=s(tD)+n2(t)

where D is the time difference of arrival (TDOA), or time lag, of the signal at one sensor with respect to the arrival time at a second sensor. You can estimate the time delay by finding the time lag that maximizes the cross-correlation between the two signals.

From the TDOA, you can estimate the broadside arrival angle of the plane wave with respect to the line connecting the two sensors. For two sensors separated by distance L, the broadside arrival angle, Broadside Angles, is related to the time lag by

sinβ=cτL

where c is the propagation speed in the medium.

A common method of estimating time delay is to compute the cross-correlation between signals received at two sensors. To identify the time delay, locate the peak in the cross-correlation. When the signal-to-noise ratio (SNR) is large, the correlation peak, τ, corresponds to the actual time delay D.

R(τ)=E{r1(t)r2(t+τ)}D^ = argmaxτR(τ)

When the correlation function is more sharply peaked, performance improves. You can sharpen a cross correlation peak using a weighting function that whitens the input signals. This technique is called generalized cross-correlation (GCC). One particular weighting function normalizes the signal spectral density by the spectrum magnitude, leading to the generalized cross-correlation phase transform method (GCC-PHAT).

S(f)=R(τ)ei2πfτdτR˜(τ)=S(f)|S(f)|e+i2πfτdfD˜ = argmaxτ R˜(τ)

If you use just one sensor pair, you can only estimate the broadside angle of arrival. However, if you use multiple pairs of non-collinear sensors, for example, in a URA, you can estimate the arrival azimuth and elevation angles of the plane wave using least-square estimation. For N sensors, you can write the delay time τkj of a signal arriving at the kth sensor with respect to the jth sensor by

cτkj=(xkxj)uu=cosαsinθi^+sinαsinθj^+cosθk^

where u is the unit propagation vector of the plane wave. The angles α and θ are the azimuth and elevation angles of the propagation vector. All angles and vectors are defined with respect to the local axes. You can solve the first equation using least-squares to yield the three components of the unit propagation vector. Then, you can solve the second equation for the azimuth and elevation angles.

References

[1] Knapp, C. H. and G.C. Carter, “The Generalized Correlation Method for Estimation of Time Delay.” IEEE Transactions on Acoustics, Speech and Signal Processing. Vol. ASSP-24, No. 4, Aug 1976.

[2] G. C. Carter, “Coherence and Time Delay Estimation.” Proceedings of the IEEE. Vol. 75, No. 2, Feb 1987.

Extended Capabilities

Version History

Introduced in R2015b