pdeviz
R2026bCreate and plot PDE visualization object
Syntax
Description
pdeviz(
creates a MeshData,NodalData)PDEVisualization object and plots the data at the mesh nodes as
a surface plot. For details, see PDEVisualization Properties.
pdeviz(___, customizes
the plot appearance using one or more Name=Value)Name=Value arguments. Use
name-value arguments with any combination of arguments from the previous syntaxes.
pdeviz(figure,___) specifies the graphics container for
the PDEVisualization object. For example, you can plot the object in
Figure 3 by specifying pdeviz(figure(3), ___).
Examples
Use the pdeviz function to create a PDE visualization object and plot it. Change the properties of this object to interact with the resulting plot.
Create an femodel object for static structural analysis and include a beam geometry into the model.
model = femodel(AnalysisType="structuralStatic", ...
                Geometry="SquareBeam.stl");
Plot the geometry.
pdegplot(model.Geometry,FaceLabels="on",FaceAlpha=0.5)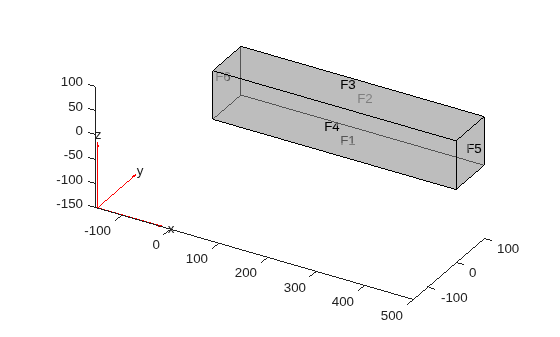
Specify Young's modulus and Poisson's ratio.
model.MaterialProperties = ...
    materialProperties(PoissonsRatio=0.3, ...
                       YoungsModulus=210E3);
Specify that face 6 is a fixed boundary.
model.FaceBC(6) = faceBC(Constraint="fixed");Specify the surface traction for face 5.
model.FaceLoad(5) = faceLoad(SurfaceTraction=[0;0;-2]);
Generate a mesh and solve the problem.
model = generateMesh(model);
structuralresults = solve(model);
Call pdeviz with only the mesh data. This call creates a PDEVisualization object and plots the mesh.
v = pdeviz(structuralresults.Mesh)
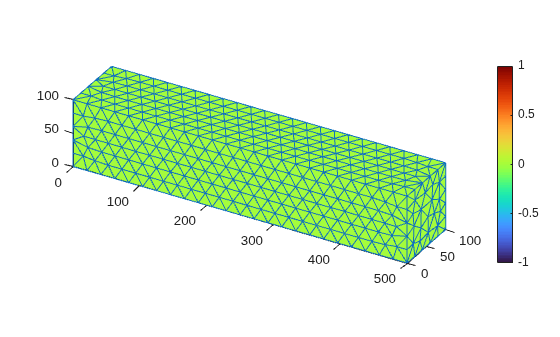
v =
  PDEVisualization with properties:

        MeshData: [1×1 FEMesh]
       NodalData: [0×1 double]
     MeshVisible: on
    Transparency: 1
        Position: [0.1300 0.1130 0.6664 0.7960]
           Units: 'normalized'

  Show all properties
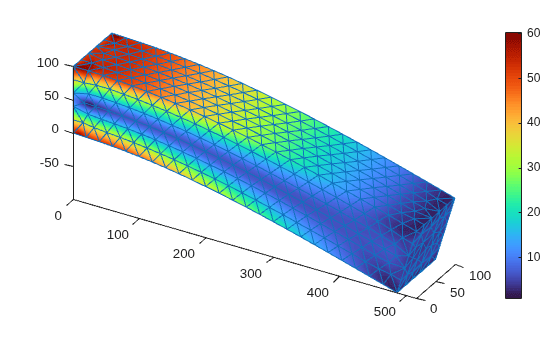
Update the plot by adding the von Mises stress as the NodalData property of the PDEVisualization object v. The plot now shows the von Mises stress and the mesh.
v.NodalData = structuralresults.VonMisesStress;
Update the plot by adding the displacement as the DeformationData property of the PDEVisualization object v. The plot shows the deformed shape with the von Mises stress.
v.DeformationData = structuralresults.Displacement;
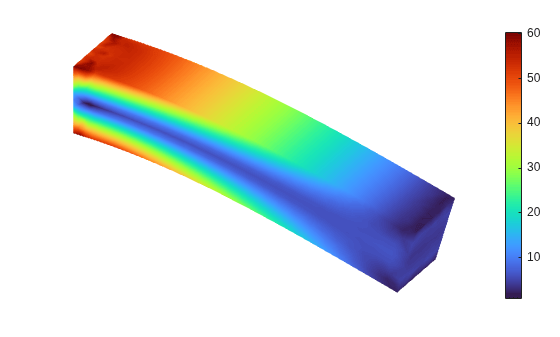
Update the plot to hide the mesh.
v.MeshVisible = "off";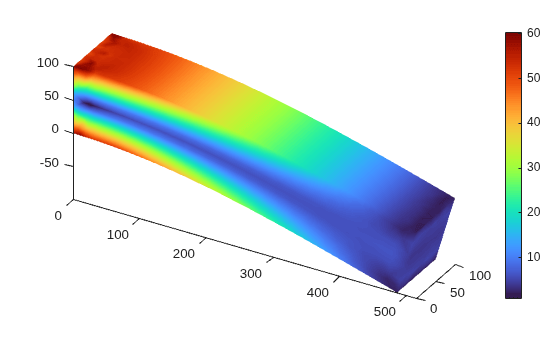
Update the plot to hide the axes.
v.AxesVisible = "off";