Monitor and Stop Optimization Running On Worker
This example shows how to run an optimization on a parallel worker and stop it early from the client without losing intermediate results. It builds on the workflow shown in Monitor During Parallel Optimizations with parfeval by introducing client-side control.
You can use a PollableDataQueue object to send instructions from the client to the workers. If your optimization function supports the OutputFcn option, you can define a custom output function that sends progress data to the client and checks for instructions from the client at each iteration. This setup enables you to stop the solver early while preserving all optimization data collected up to that point.
In this example, you run an optimization that you stop early by using a PollableDataQueue object to send a termination signal from the client.
Start a parallel pool with one worker on the local machine.
parpool("Processes",1);Starting parallel pool (parpool) using the 'Processes' profile ... Connected to parallel pool with 1 workers.
Define Problem
The problem is to minimize the two-variable Rosenbrock function [1], .
Define the objective function and set the initial point to [−1.9,2].
fun = @(x)(100*(x(2) - x(1)^2)^2 + (1 - x(1))^2);
x0 = [-1.9, 2];
Set Up Pollable Data Queue
To send instructions to the worker, create a PollableDataQueue object with the Destination argument set to "any". This type of PollableDataQueue object allows any worker or the client to send and receive messages.
stopPdq = parallel.pool.PollableDataQueue(Destination="any");Prepare Plots and Data Queue to Visualize Optimization Progress
Set up a figure and an animated line to visualize the optimization progress.
fig = figure(Visible="off",Name="Optimization Plot Function");
hline = animatedline(NaN,NaN, ...
        Color="none",Marker="o",MarkerFaceColor="b");
Create a DataQueue object to send progress data from the worker to the client.
plotDq = parallel.pool.DataQueue;
To plot the data in the DataQueue, use afterEach to run a custom plot function, plotSolverProgress, each time the DataQueue receives data. The plotSolverProgress helper function is defined at the end of the example.
afterEach(plotDq,@(data) plotSolverProgress(hline,data{:}));Start Optimization and Send Stop Message
Create options for fminunc that use a custom output function, sendProgressAndStop, to send progress and listen for client instructions. The sendProgressAndStop helper function is defined at the end of the example. Pass the plotDq and stopPdq objects to the worker through an anonymous function.
outFcn = @(x,v,s) sendProgressAndStop(x,v,s,plotDq,stopPdq);
opts = optimoptions("fminunc",OutputFcn=outFcn, ...
    Algorithm="quasi-newton");
Schedule a parfeval computation to run the fminunc function on a worker.
solverF = parfeval(@fminunc,4,fun,x0,opts);
Show the figure to visualize the optimization progress.
fig.Visible = "on";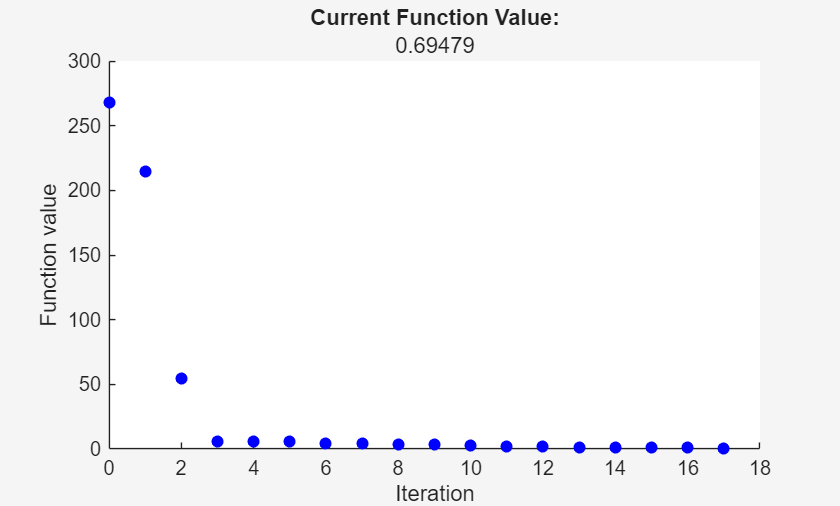
parfeval does not block MATLAB®, so you can continue running commands. In this case, stop the optimization by sending a message to the worker.
Let the optimization run for ten seconds then send a "stop" message to the worker using the stopPdq PollableDataQueue object.
pause(10)
send(stopPdq,"stop");
Retrieve Partial Results
Retrieve the parfeval results and display the exit message from the solver. When you stop the optimization via the output function, fminunc returns the most recent solution, the corresponding objective function value, and intermediate information about the optimization process.
[sol,fval,eflag,output] = fetchOutputs(solverF);
output.message
ans =
'fminunc stopped by the output or plot function.'
References
[1] Rosenbrock, H. H. “An Automatic Method for Finding the Greatest or Least Value of a Function.” The Computer Journal 3, no. 3 (1960): 175–84. https://doi.org/10.1093/comjnl/3.3.175.
Helper Functions
sendProgressAndStop Function
The sendProgressAndStop function sends progress data to the client using a DataQueue object and checks for instructions from the client using a PollableDataQueue object. When the client session sends a "stop" message, the function changes the stop flag to true, which stops the optimization. For more information about the structure of an output function, see Output Function and Plot Function Syntax (Optimization Toolbox).
function stop = sendProgressAndStop(x,values,state,plotDq,stopPdq)
stop = false;
send(plotDq,{x,values,state});
pause(0.5) % Simulate an expensive iteration by pausing
in = poll(stopPdq);
if strcmp(in,"stop")
    stop = true;
end
end
plotSolverProgress Function
The plotSolverProgress function visualizes solver progress during execution. It uses a switch statement to handle init, iter, and done states of the optimization process and updates a plot accordingly. For more information on the structure of a plot function, see Output Function and Plot Function Syntax (Optimization Toolbox).
function plotSolverProgress(hline,~,optimValues,state)
switch state
    case 'init'
        clearpoints(hline)
        xlabel("Iteration");
        ylabel("Function value");
    case 'iter'
        addpoints(hline,optimValues.iteration,optimValues.fval);
        title("Current Function Value:",num2str(optimValues.fval));
        drawnow limitrate nocallbacks
    case 'done'
        title("Final Function Value:",num2str(optimValues.fval));
        drawnow limitrate nocallbacks
end
end