2 次元プロットでの基本統計の確認
この例では、データの統計量ツールを使用して、プロットされたデータを対話的に確認および要約する方法を示します。このツールを使用すると、プロット上でデータ系列の基本統計を検査および可視化し、統計を MATLAB ワークスペースに保存してさらに解析できます。統計ごとにコードを記述する必要がありません。
この例では、15 個の岩石の質量 (g) と体積 (立方 cm) の測定値からなるサンプル データを解析します。
Mass = [250 320 180 405 289 340 210 370 295 310 282 400 195 355 275]';
Volume = [100 130 90 150 120 140 95 160 110 125 119 152 87 138 108]';
T = table(Mass,Volume);
データの可視化
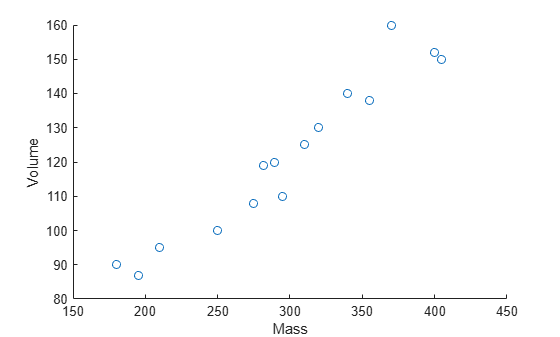
散布図を使用して、各岩石の質量と体積のデータを可視化します。
scatter(T,"Mass","Volume")
プロットでの統計の表示
データの統計量ツールを使用するには、Figure の [ツール] タブで [データの統計量] をクリックします。データの統計量ツールで、質量と体積の測定値に関する記述統計が表示されます。プロット上に特定の統計を表示するには、表示する各統計のチェック ボックスを選択します。
たとえば、平均質量および体積を表示するには、[X] 列と [Y] 列の [平均値] チェック ボックスを選択します。このアクションにより、プロット上の平均質量および体積の位置に垂直線と水平線が作成され、凡例も自動的に追加されます。
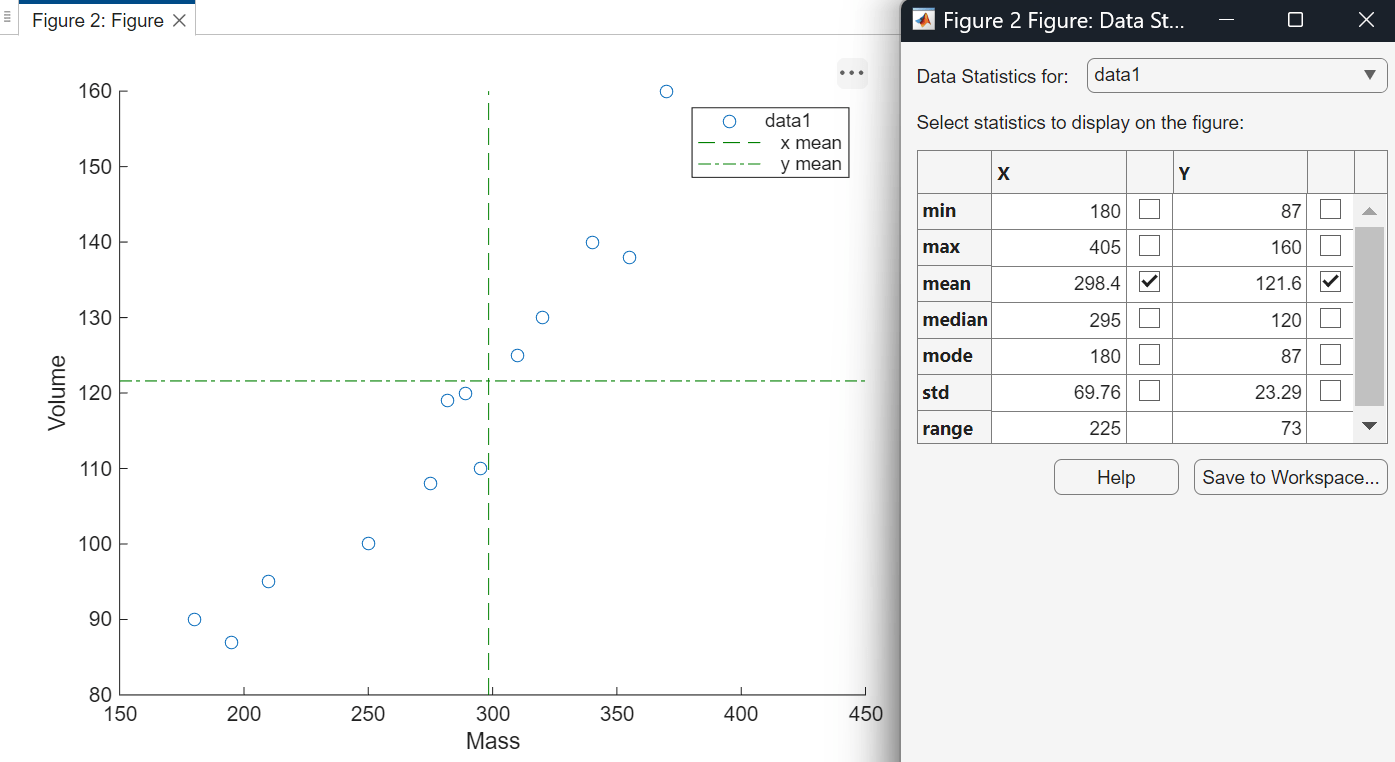
プロットに複数のデータ系列が含まれている場合は、[データの統計量の対象] リストで、統計を計算する系列を選択します。別のデータ系列を選択すると、以前選択したデータ系列の統計がプロットからクリアされます。
ワークスペースへの統計の保存
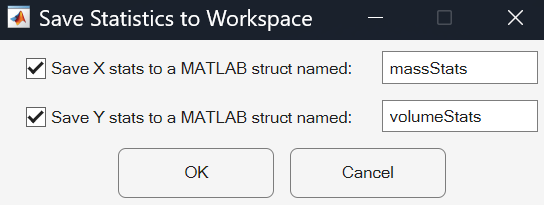
さらに解析するためにすべての統計を保存するには、[ワークスペースに保存] をクリックします。データの統計量ツールは、統計を MATLAB ワークスペースにスカラー構造体として保存します。各構造体の名前を指定できます。
各構造体の内容は変数エディターで表示できます。
openvar massStats
openvar volumeStats
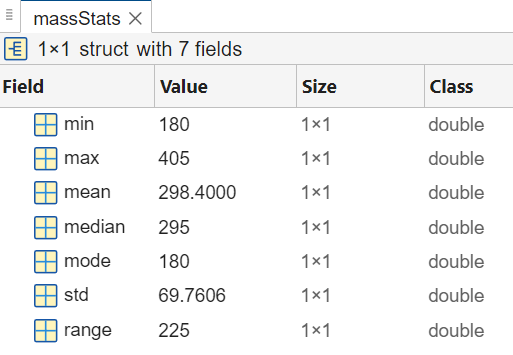
ドット表記を使用して、構造体内の統計にアクセスできます。たとえば、質量測定値の標準偏差にアクセスし、分散を計算します。
massVar = massStats.std .^ 2;