階段状プロットとライン プロットの重ね合わせ
この例では、階段状プロットにライン プロットを重ねる方法を説明します。
プロットするデータを定義します。
alpha = 0.01;
beta = 0.5;
t = 0:10;
f = exp(-alpha*t).*sin(beta*t);
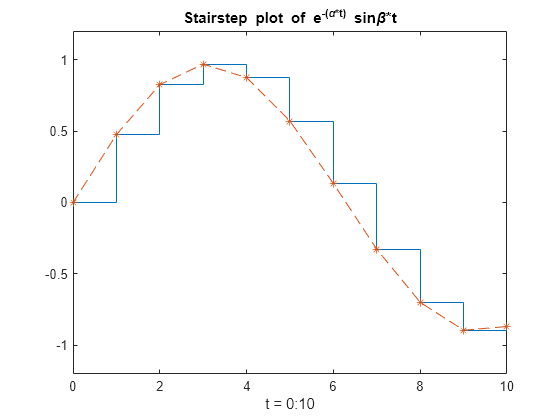
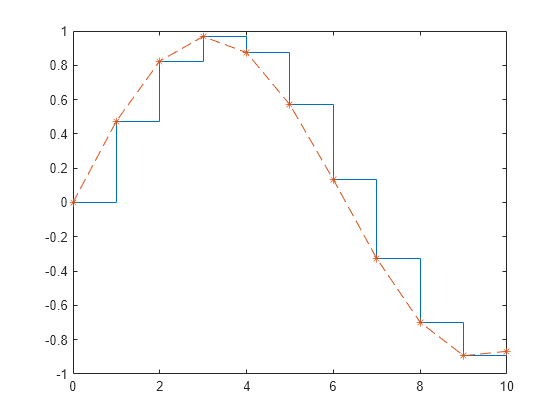
f を階段状プロットとして表示します。関数 hold を使用して、階段状プロットを保持します。星マーカー付きの破線を使用して、f のライン プロットを追加します。
stairs(t,f)
hold on
plot(t,f,'--*')
hold off
関数 axis を使用して軸の範囲を設定します。X 軸にラベルを付け、タイトルをグラフに追加します。
axis([0,10,-1.2,1.2])
xlabel('t = 0:10')
title('Stairstep plot of e^{-(\alpha*t)} sin\beta*t')