アプリ内での表形式データの書式設定
table 配列は、表形式データを MATLAB® 変数として保存する場合に便利です。たとえば、関数 readtable を呼び出して、スプレッドシートから table 配列を作成することができます。Table UI コンポーネントを使用して、アプリで table 配列データを表示し、特定のデータ型の対話型編集機能を利用できます。関数 uifigure で作成された App Designer のアプリおよび Figure のみが、Table UI コンポーネントでの table 配列の使用をサポートします。
App Designer を使用して表形式データを表示する場合は、まず [設計ビュー] で Table UI コンポーネントを作成します。次に、このページの例を使用してデータを書式設定し、[コード ビュー] で Table UI コンポーネントのプロパティを設定します。App Designer での table の使用の詳細については、App Designer アプリへのテーブルの追加を参照してください。
テーブル コンポーネントでこれらのデータ型の一部を使用する完全にコード化されたサンプル アプリを確認するには、アプリでの対話型のテーブルの作成を参照してください。
数値データ
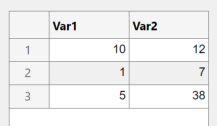
Table UI コンポーネントでは、数値データは右揃えの値として表示されます。
fig = uifigure;
tdata = table([10; 1; 5],[12; 7; 38]);
uit = uitable(fig,'Data',tdata);
uit.Position(3) = 200;
uit.RowName = 'numbered';
logical データ
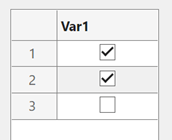
logical 値はチェック ボックスとして表示されます。true 値はオンで、false 値はオフです。Table UI コンポーネントの ColumnEditable プロパティが true の場合、ユーザーはアプリ内でチェック ボックスを選択してオフにすることができます。
fig = uifigure;
tdata = table([true; true; false]);
uit = uitable(fig,'Data',tdata);
uit.Position(3) = 130;
uit.RowName = 'numbered';
categorical データ
categorical 値はドロップダウン リストまたはテキストとして表示されます。Table UI コンポーネントの ColumnEditable プロパティが true の場合、カテゴリはドロップダウン リストに表示されます。それ以外の場合は、カテゴリはドロップダウン リストなしのテキストとして表示されます。
fig = uifigure;
cnames = categorical({'Blue';'Red'},{'Blue','Red'});
w = [400; 700];
tdata = table(cnames,w,'VariableNames',{'Color','Wavelength'});
uit = uitable(fig,'Data',tdata,'ColumnEditable',true);

categorical 配列が保護されていない場合、ユーザーは実行中のアプリでセルに入力することによって新しいカテゴリを追加できます。
datetime データ
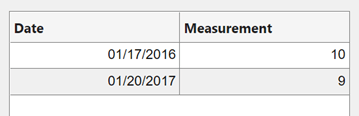
datetime 値は、対応する table 変数 (datetime 配列) の Format プロパティに従って表示されます。
fig = uifigure;
dates = datetime([2016,01,17; 2017,01,20],'Format','MM/dd/uuuu');
m = [10; 9];
tdata = table(dates,m,'VariableNames',{'Date','Measurement'});
uit = uitable(fig,'Data',tdata);
形式を変更するには、ドット表記を使用して table 変数の Format プロパティを設定します。次に、Table UI コンポーネント内のデータを置換します。
tdata.Date.Format = 'dd/MM/uuuu';
uit.Data = tdata;
Table UI コンポーネントの ColumnEditable プロパティが true の場合、ユーザーはアプリ内で日付値を変更できます。列が編集可能な場合、アプリでは、datetime 配列の Format プロパティに従った入力値が想定されます。ユーザーが無効な日付を入力すると、テーブルに表示される値は NaT になります。
duration データ
duration 値は、対応する table 変数 (duration 配列) の Format プロパティに従って表示されます。
fig = uifigure;
mtime = duration([0;0],[1;1],[20;30]);
dist = [10.51; 10.92];
tdata = table(mtime,dist,'VariableNames',{'Time','Distance'});
uit = uitable(fig,'Data',tdata);

形式を変更するには、ドット表記を使用して table 変数の Format プロパティを設定します。
tdata.Time.Format = 's';
uit.Data = tdata;
Table UI コンポーネントの ColumnEditable が true の場合でも、duration 値を含むセルは実行中のアプリでは編集できません。
非スカラー データ
非スカラー値のアプリ内での表示方法は、コマンド ウィンドウでの表示と同じです。たとえば、次の table 配列には 3 次元配列と struct 配列が含まれています。
fig = uifigure;
arr = {rand(3,3,3); rand(3,3,3)};
s = {struct; struct};
tdata = table(arr,s,'VariableNames',{'Array','Structure'});
uit = uitable(fig,'Data',tdata);
複数列の table 配列変数が、コマンド ウィンドウでの表示と同様に、アプリ内でも列の組み合わせとして表示されます。たとえば、この table 配列の変数 RGB は 3 行 3 列の配列です。
n = [1;2;3];
rgbs = [128 122 16; 0 66 155; 255 0 0];
tdata = table(n,rgbs,'VariableNames',{'ROI','RGB'})
tdata =

  3×2 table

    ROI           RGB
    ___    _________________

     1     128    122     16
     2       0     66    155
     3     255      0      0
Table UI コンポーネントでも同様の表示となります。RGB 列で項目を選択すると、その行のサブ列がすべて選択されます。Table UI コンポーネントの ColumnEditable プロパティが true の場合でも、サブ列内の値は実行中のアプリでは編集できません。
fig = uifigure;
uit = uitable(fig,'Data',tdata);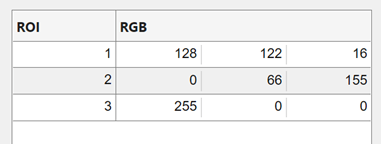
欠損データ値
欠損値は、データ型に従ってインジケーターとして表示されます。
欠損 string は
<missing>として表示されます。未定義の
categorical値は<undefined>として表示されます。無効または未定義の数値または
duration値はNaNとして表示されます。無効または未定義の
datetime値はNaTとして表示されます。
Table UI コンポーネントの ColumnEditable プロパティが true の場合、ユーザーは実行中のアプリ内で値を修正できます。
fig = uifigure;
sz = categorical([1; 3; 4; 2],1:3,{'Large','Medium','Small'});
num = [NaN; 10; 12; 15];
tdata = table(sz,num,'VariableNames',{'Size','Number'});
uit = uitable(fig,'Data',tdata,'ColumnEditable',true);