preview
Description
Add-On Required: This feature requires the Lidar Toolbox Support Package for SICK Lidar Sensors add-on.
preview( previews live point cloud data
from the SICK® lidar sensor associated with the slObj)sicklidar object
slObj. The function opens a preview window to display the point cloud
data.
Note
The function removes all available point clouds from the
sicklidar object buffer before previewing live point cloud
data.
Examples
Create a sicklidar object. Ensure that you specify the correct IP address for your sensor.
slObj = sicklidar(IPAddress="192.168.0.112");Preview the point cloud data using the preview object function of the sicklidar object. The preview window opens with the axes limits specified by the three vectors you pass to the preview function. Note that you must close the preview window before you can use the read object function.
preview(slObj,[-5 20],[-10 20],[-1 3])
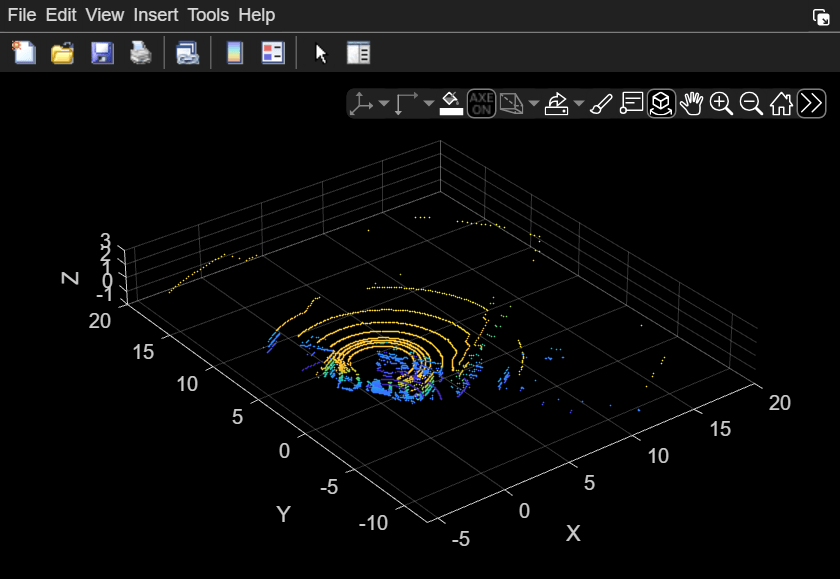
After you preview the data, close the preview window by using the closePreview object function.
closePreview(slObj)
Input Arguments
Version History
Introduced in R2026a
See Also
sicklidar | sicklidar2d | start | read | closePreview | flush | stop