エッジ保存型フィルター処理が行われたサーモグラフィ イメージのセグメント化
この例では、サーマル イメージの操作方法を説明し、簡単なセグメンテーションを示します。サーマル イメージは、電磁スペクトルの赤外線範囲の放射エネルギーを検出するサーモグラフィ カメラから得られます。サーモグラフィ イメージはすべての物体から放出される絶対零度以上の赤外線放射エネルギーを取り込んでいます。
サーマル イメージをワークスペースに読み取り、whos を使用してイメージ データの詳細を把握します。
I = imread("hotcoffee.tif");

whos I
  Name        Size              Bytes  Class     Attributes

  I         240x320            307200  single
データが占めるダイナミック レンジを計算して、イメージが占める温度の範囲を確認します。このイメージのピクセル値は、摂氏温度スケールの実際の温度に対応します。
range = [min(I(:)) max(I(:))]
range = 1×2 single row vector

   22.4729   77.3727
サーマル イメージを表示します。サーマル イメージは、ダイナミック レンジが 0 から 1 の範囲にない単精度イメージであるため、imshow のオートスケーリング機能を使用してイメージを表示しなければなりません。
figure
imshow(I,[])
colormap(gca,hot)
title("Original image")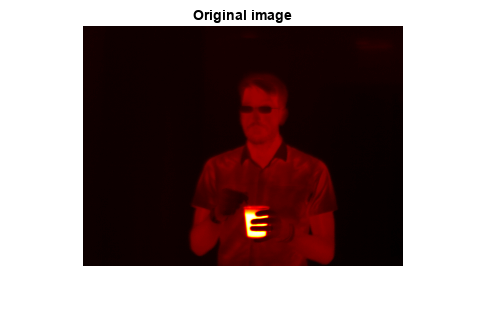
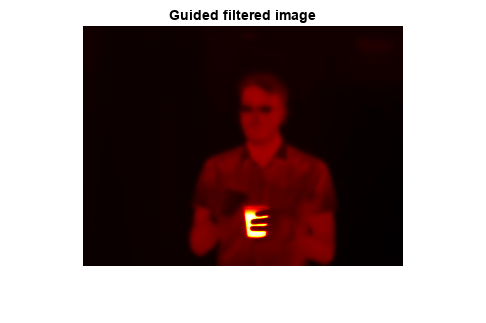
エッジ保存平滑化をイメージに適用し、イメージの詳細を保持しながらノイズを取り除きます。この前処理手順の後にセグメンテーションを行います。関数 imguidedfilter を使用し、自己ガイドの下で平滑化を実行します。平滑化の量を制御する名前と値の引数 DegreeOfSmoothing はイメージの範囲に依存します。サーモグラフィ イメージの範囲に合わせて DegreeOfSmoothing を調整します。フィルター処理されたイメージを表示します。
smoothValue = 0.01*diff(range).^2;
J = imguidedfilter(I,"DegreeOfSmoothing",smoothValue);

figure
imshow(J,[])
colormap(gca,hot)
title("Guided filtered image")
セグメンテーションで使用するしきい値を決定します。イメージには、強度 (温度) がはっきりと区別されるような 3 つの独立した領域 (人物、熱い物体、背景) があります。multithresh を使用し、イメージの 2 レベルしきい値を計算します。これで Otsu 法によりイメージが 3 つの領域に分割されます。
thresh = multithresh(J,2)
thresh = 1×2 single row vector

   27.0018   47.8220
multithresh で返された値を使用し、イメージのしきい値処理を行います。しきい値は 27℃と 48℃になります。最初のしきい値は背景と人物の強度を分離し、2 番目のしきい値は人物と熱い物体を分離します。イメージをセグメント化し、穴を塗りつぶします。
L = imquantize(J,thresh);
L = imfill(L);

figure
imshow(label2rgb(L))
title("Label matrix from 3-level Otsu")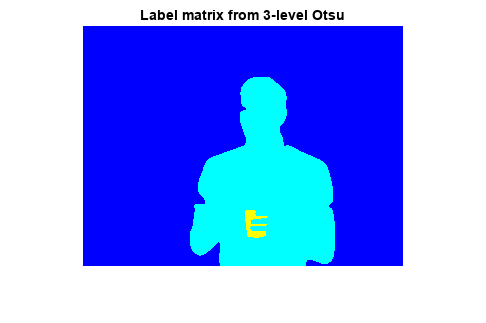
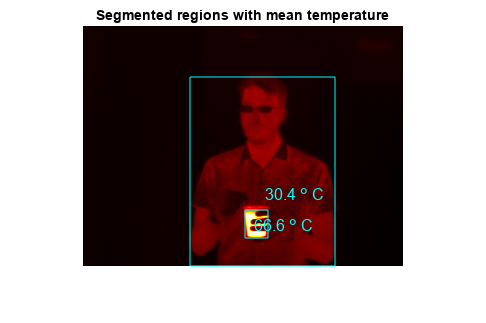
イメージの前景領域を囲む境界ボックスを描画し、領域の温度平均値をボックス内に配置します。この例では背景を最大領域と仮定しています。関数 regionprops を使用し、セグメント化されたイメージ内の領域情報を取得します。
props = regionprops(L,I,["Area","BoundingBox","MeanIntensity","Centroid"]);

% Find the index of the background region.
[~,idx] = max([props.Area]);

figure
imshow(I,[])
colormap(gca,hot)
title("Segmented regions with mean temperature")
for n = 1:numel(props)
    % If the region is not background
    if n ~= idx
        % Draw bounding box around region
       rectangle("Position",props(n).BoundingBox,"EdgeColor","c")

       % Draw text displaying mean temperature in Celsius
       T = num2str(props(n).MeanIntensity,3)+" \circ C";
       text(props(n).Centroid(1),props(n).Centroid(2),T,...
           "Color","c","FontSize",12)
    end
end
参考
imquantize | imguidedfilter | multithresh | imfill