spot
Description
Add-On Required: This feature requires the Optical Design and Simulation Library for Image Processing Toolbox add-on.
rms = spot(opsys,Name=Value)Wavelengths=[475 550 600] specifies the wavelengths at which to
compute the RMS spot size as 475, 550, and 600 nanometers.
Examples
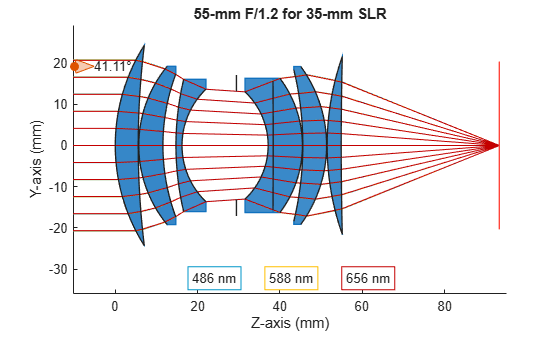
Load a double Gauss lens from a ZMX file into the workspace.
opsys = zmximport("DoubleGaussLens.zmx");Trace rays through the optical system using the traceRays object function.
rb = traceRays(opsys);
Display the optical system using the view2d object function, and visualize the traced rays through the system using the addRays object function.
hv = view2d(opsys);
addRays(hv,rb)
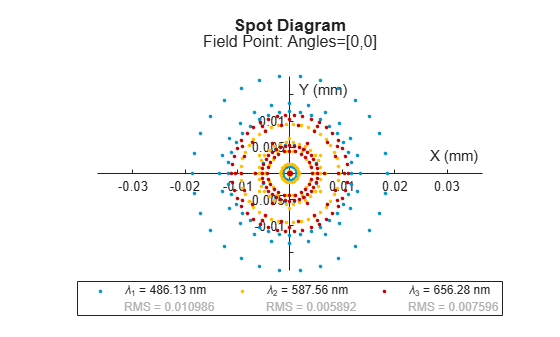
Compute the RMS spot size using the spot object function. Visualize the spot diagram using the spotDiagram function.
spr = spot(opsys)
spr =
  Spot with properties:

                     RMS: [0.0110 0.0059 0.0076]
    RayBundleHitPosition: {[169×2 double]  [169×2 double]  [169×2 double]}
     ChiefRayHitPosition: [3×2 double]
              FieldPoint: [1×1 optics.fieldpoint.FieldAngle]
             Wavelengths: [486.1340 587.5618 656.2810]
spotDiagram(spr);
Input Arguments
Name-Value Arguments
Output Arguments
Algorithms
The spot object function first computes the entrance pupil for
each wavelength, and then computes the RMS spot size using these steps.
Determine the coordinate location at which the chief ray hits the image plane.
Trace rays by sampling the entrance pupil using the pupil grid specified by the
SamplingGridname-value argument, and determine the coordinate locations at which the rays hit the image plane.Compute the ray spot diagram using this equation, where (xc, yc) is the center around which to evaluate the spot size, and (xi, yi) is the location of the one of the N traced rays [1].
References
[1] "#DevOptical Part 10: RMS Spot Size." Accessed December 20, 2024. https://www.thepulsar.be/article/-devoptical-part-10--rms-spot-size/.
Version History
Introduced in R2026a