imseggeodesic
Segment image into two or three regions using geodesic distance-based color segmentation
Syntax
Description
L = imseggeodesic(RGB,BW1,BW2)RGB, returning a
segmented binary image with labels L.
BW1 and BW2 are
binary images that specify the location of the initial seed regions,
called scribbles, for the two regions
(foreground and background).
imseggeodesic uses the scribbles specified in
BW1 and BW2 as
representative samples for computing the statistics for their
respective regions, which it then uses in segmentation. The
scribbles specified by BW1 and
BW2 (regions that are logical true)
should not overlap. The underlying algorithm uses the statistics
estimated over the regions marked by the scribbles for segmentation.
The greater the number of pixels marked by scribbles, the more
accurate the estimation of the region statistics, which typically
leads to more accurate segmentation. Therefore, it is a good
practice to provide as many scribbles as possible. Typically,
provide at least a few hundred pixels as scribbles for each
region.
L = imseggeodesic(RGB,BW1,BW2,BW3)RGB, returning a
segmented image with three segments (trinary segmentation) with the
region labels specified by label matrix L.
BW1, BW2, and
BW3 are binary images that specify the
location of the initial seed regions or scribbles for the three
regions. The scribbles specified by BW1,
BW2, and BW3
(regions that are logical true) should not
overlap.
L =
imseggeodesic(___,"AdaptiveChanneWeighting",tf)imseggeodesic
function performs the segmentation using adaptive channel weighting.
When you specify tf as true,
imseggeodesic uses using adaptive
channel weighting. By default, the value of tf
is false and imseggeodesic
weights all the channels equally.
Examples
Read and display an image.
RGB = imread('yellowlily.jpg');
imshow(RGB)
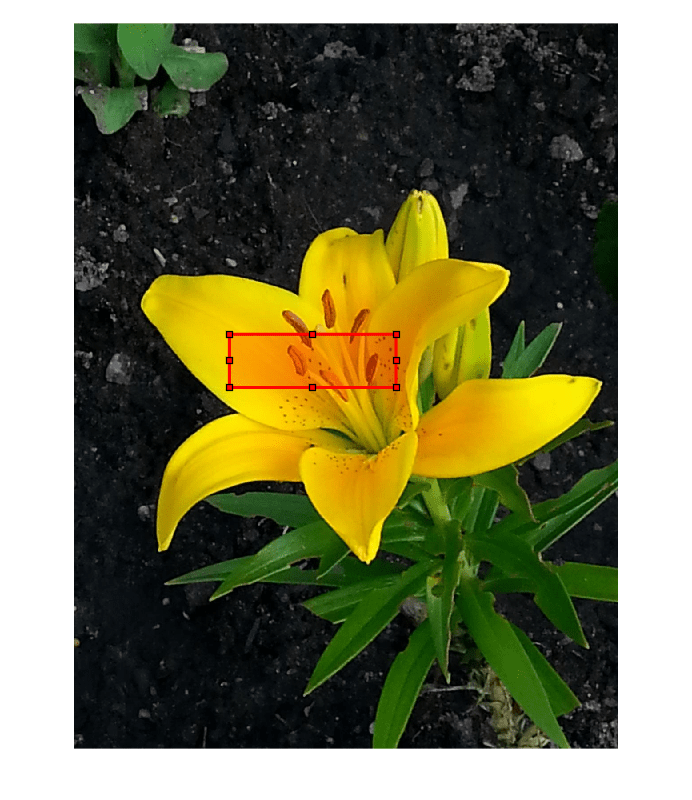
The goal is to segment the petals of the flower. Specify the initial seed region as a rectangular ROI by using the drawrectangle function. Display the ROI in red. The 'Position' name-value pair argument specifies the upper left coordinate, width, and height of the ROI as the 4-element vector [xmin, ymin, width, height]. If you want to draw the rectangle interactively, then omit the 'Position' name-value pair argument.
roiObject = drawrectangle(gca,'Position',[350 700 375 120],'Color','r');
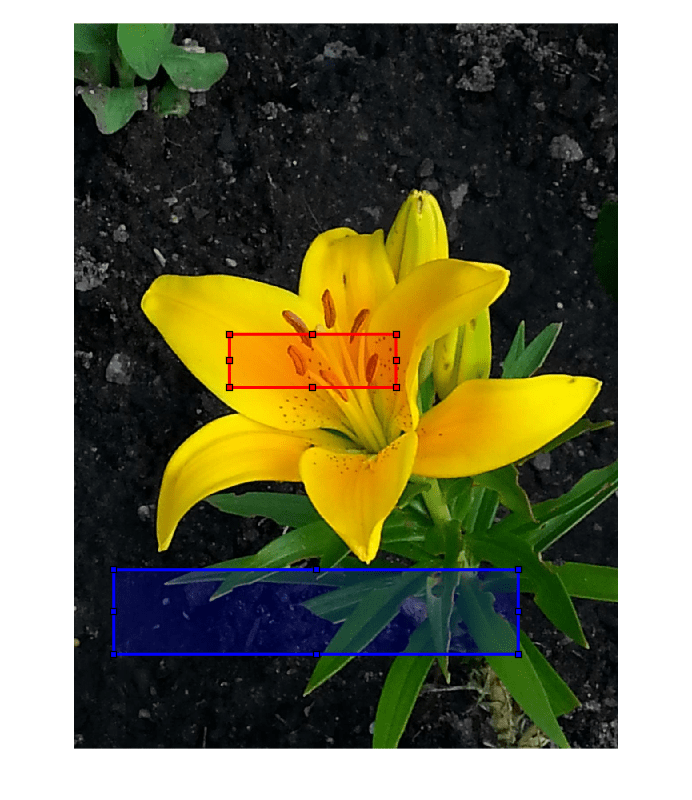
Specify the initial seed regions for the background as a rectangular ROI. Display the ROI in blue.
roiBackground = drawrectangle(gca,'Position',[90 1230 910 190],'Color','b');
Create a mask for each ROI in which the ROI is true and other pixels are false.
maskObject = createMask(roiObject);
maskBackground = createMask(roiBackground);
Segment the image.
[L,P] = imseggeodesic(RGB,maskObject,maskBackground);
Display the segmented labels.
imshow(label2rgb(L))
title('Segmented Labels')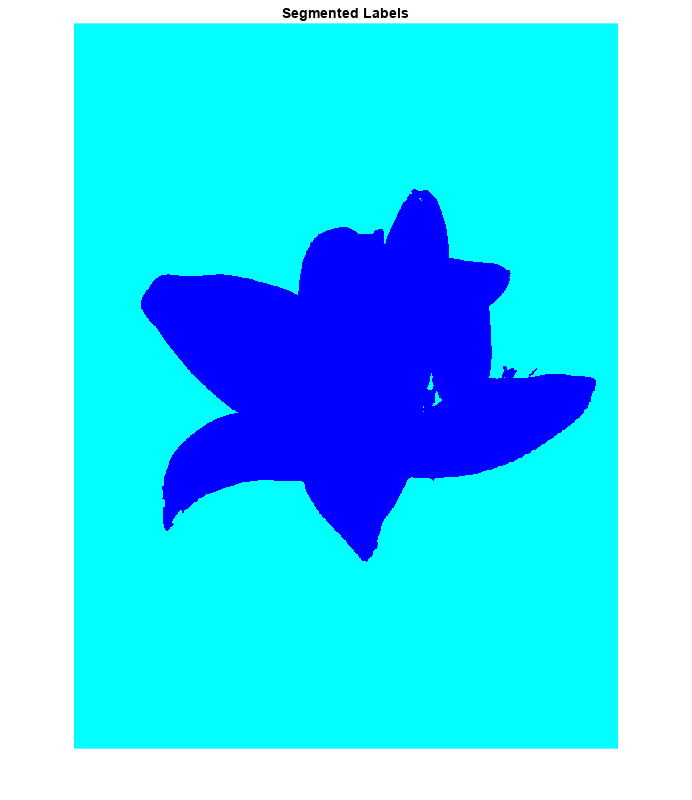
Display the segmented labels over the original image.
imshow(labeloverlay(RGB,L))
title('Labels Overlaid on Original Image')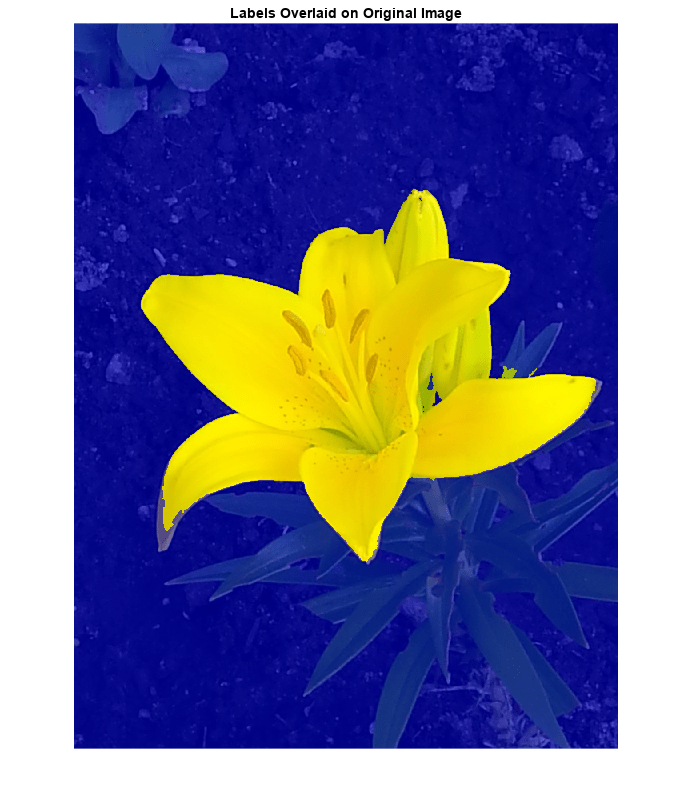
Read and display an image.
RGB = imread('yellowlily.jpg');
imshow(RGB)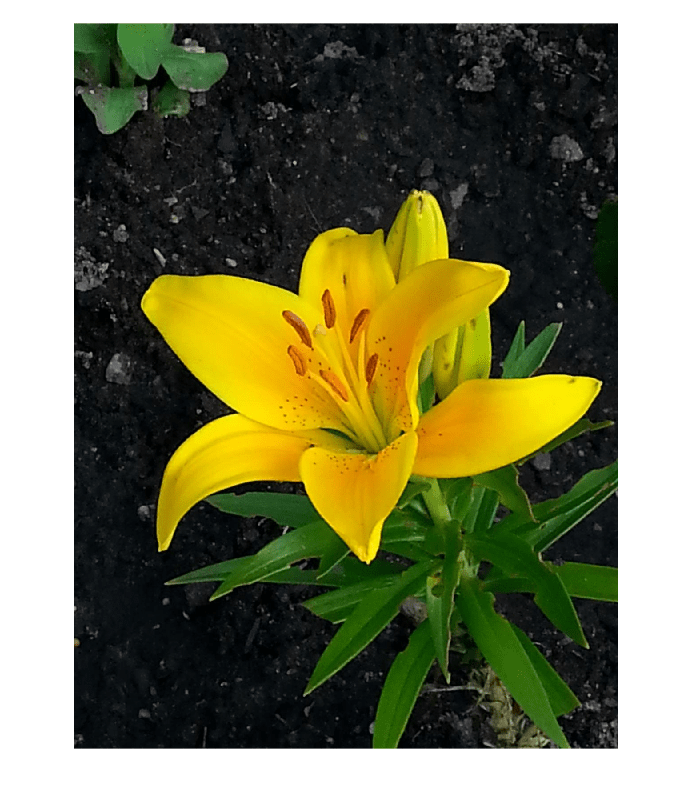
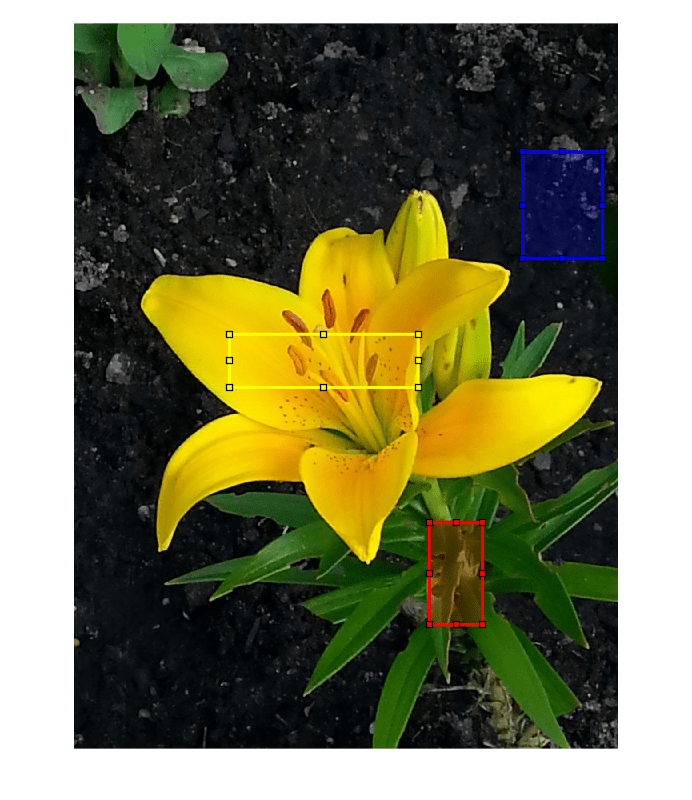
The first region consists of the yellow flower petals. Specify the initial seed region as a rectangular ROI by using the drawrectangle function. Draw the ROI in yellow. The 'Position' name-value pair argument specifies the upper left coordinate, width, and height of the ROI as the 4-element vector [xmin, ymin, width, height]. If you want to draw the rectangle interactively, then omit the 'Position' name-value pair argument.
r1 = drawrectangle(gca,'Position',[350 700 425 120],'Color','y');

The second region consists of the green leaves. Specify the seed region as a rectangular ROI and draw the ROI in red.
r2 = drawrectangle(gca,'Position',[800 1124 120 230],'Color','r');

The third region is background, which is the dirt in this image. Specify the seed region as a rectangular ROI and draw the ROI in blue.
r3 = drawrectangle(gca,'Position',[1010 290 180 240],'Color','b');
Create a mask for each ROI in which the ROI is true and other pixels are false.
mask1 = createMask(r1);
mask2 = createMask(r2);
mask3 = createMask(r3);
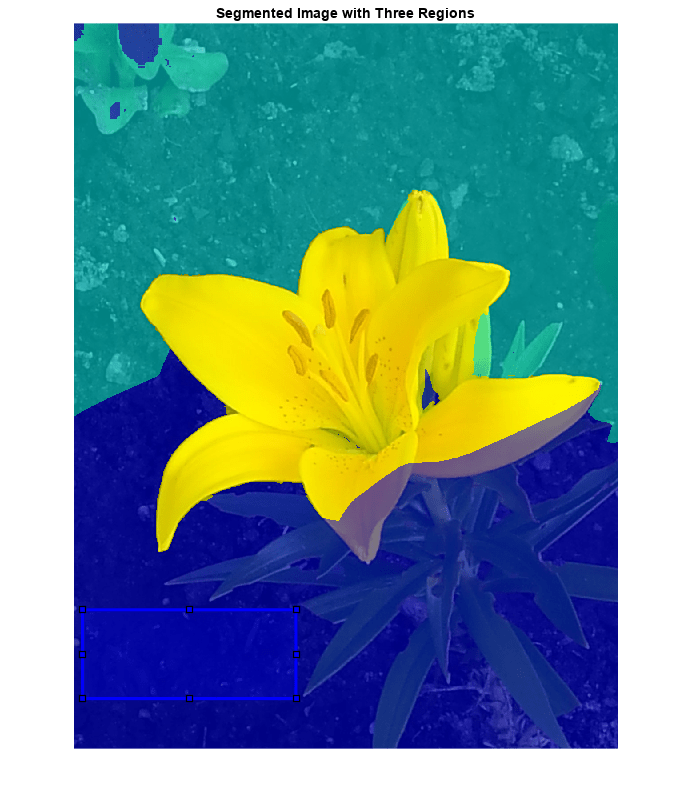
Segment the image.
[L,P] = imseggeodesic(RGB,mask1,mask2,mask3,'AdaptiveChannelWeighting',true);Display the segmented labels over the original image.
imshow(labeloverlay(RGB,L))
title('Segmented Image with Three Regions')
The lower right corner of the image is misclassified as region 2 (leaves). Add another background ROI.
r4 = drawrectangle(gca,'Position',[20 1320 480 200],'Color','b');
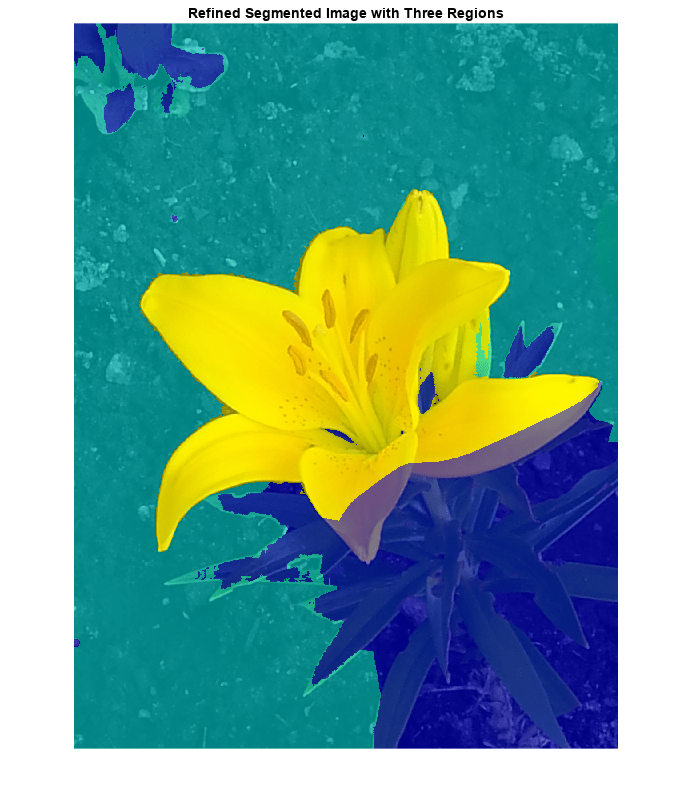
mask4 = createMask(r4);
maskBackground = mask3 + mask4;
Segment the image then display the segmented labels over the original image.
[L,P] = imseggeodesic(RGB,mask1,mask2,maskBackground,'AdaptiveChannelWeighting',true);
imshow(labeloverlay(RGB,L))
title('Refined Segmented Image with Three Regions')
Display the probability that each pixel is belongs to each label.
montage(P,'Size',[1 3])
title('Probability That Each Pixel Belongs to Each Label')

Input Arguments
Output Arguments
Tips
Algorithms
imseggeodesic uses a geodesic distance-based color segmentation algorithm
(similar to [1]).
References
[1] A. Protiere and G. Sapiro, Interactive Image Segmentation via Adaptive Weighted Distances, IEEE Transactions on Image Processing. Volume 16, Issue 4, 2007.
Version History
Introduced in R2015a