このページは機械翻訳を使用して翻訳されました。最新版の英語を参照するには、ここをクリックします。
surrogateoptplotを解釈する
surrogateoptplot プロット関数は、サロゲート最適化手順に関する多くの情報を提供します。
有界関数の最小化
たとえば、この例を実行すると利用できるテスト関数 rastriginsfcn に対して surrogateopt が実行するテストのプロットを考えてみます。この関数は、[0,0]の点で大域的最小値0を持ちます。
rastriginsfcn の表面プロットを作成します。
ezsurf(@(x,y)rastriginsfcn([x(:),y(:)]));
![Figure contains an axes object. The axes object with title r a s t r i g i n s f c n ( [ x ( : ) , y ( : ) ] ), xlabel x, ylabel y contains an object of type surface.](interpretsurrogateoptplotexample_01_ja_JP.png)
プロット最小化プロセス
非対称の境界を与えると、surrogateopt が大域的最小値から離れて探索するようになります。[-3,-3] と [9,10] の非対称境界を設定します。surrogateoptplot プロット関数を使用するようにオプションを設定し、surrogateopt を呼び出します。
lb = [-3,-3];
ub = [9,10];
options = optimoptions('surrogateopt','PlotFcn','surrogateoptplot');
rng(100)
[x,fval] = surrogateopt(@rastriginsfcn,lb,ub,options);
surrogateopt stopped because it exceeded the function evaluation limit set by
'options.MaxFunctionEvaluations'.
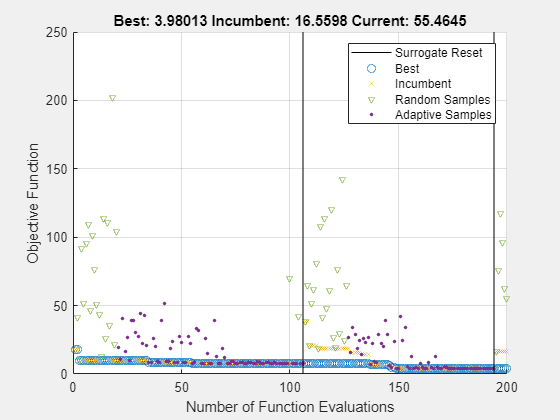
プロットを解釈する
プロットの左側から解釈を始めます。アルゴリズムの手順の詳細については、サロゲート最適化アルゴリズム を参照してください。
最初の点は色付きの三角形で、問題の範囲内での関数の準ランダム サンプルを示します。凡例で「ランダム サンプル」とラベル付けされているこれらのポイントは、サロゲートの構築フェーズから取得されます。
次の点は、最小値の探索フェーズで作成された適応ポイントを示します。これらのポイントは凡例で「適応サンプル」というラベルが付けられます。
重なり合って太い線のように見える円は、見つかった最良(最低)の目的関数値を表します。これらのポイントは凡例で「ベスト」と表示されます。評価番号 30 の直後、
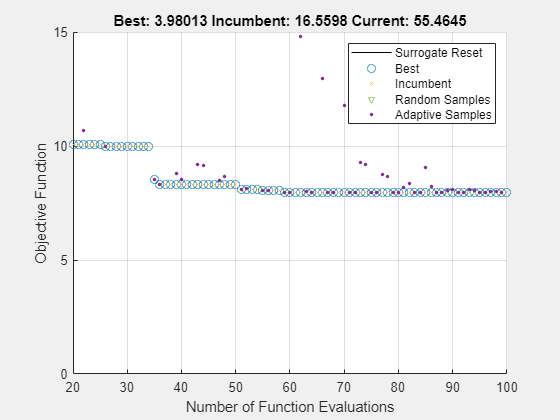
surrogateoptは目的関数の値が 8 付近の局所的最小値に陥ります。この動作をより明確に確認するには、ズームインしてください。
xlim([20 100])
ylim([0 15])
評価番号 120 より前では、垂直線はサロゲート リセットを示します。この時点で、アルゴリズムはサロゲート構築フェーズに戻ります。
色付きの x ポイントは現職者を表し、前回のサロゲート リセット以降に見つかった最良のポイントです。
評価番号 150 付近では、現職者は約 4 の値を達成して、以前の最高点を上回っています。この動作をより明確に確認するには、ズームインしてください。
xlim([140 200])
ylim([0 6])
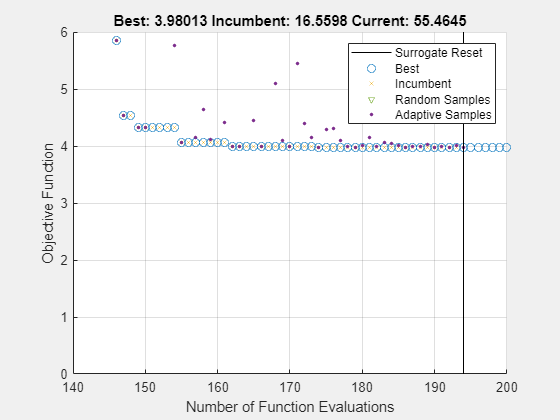
ソルバーは評価 190 の後に別のサロゲート リセットを実行します。
2D 問題に対するデフォルトの関数評価制限である評価番号 200 で最適化は停止します。
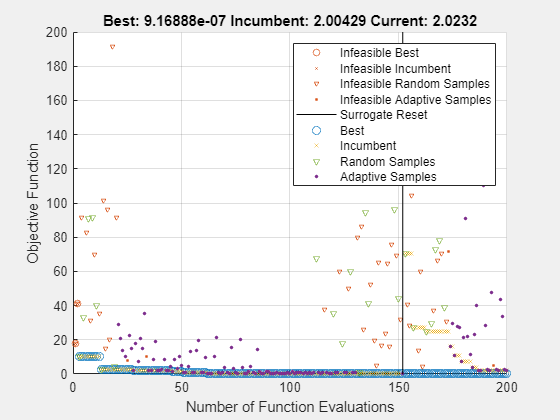
非線形および整数制約の問題
非線形制約がある場合、surrogateoptplot の表示が変わります。x(1) が整数値であるという制約と、 が非線形であるという制約を課します。この制約を実装する関数については、この例の最後にある rasfcn を参照してください。
fun = @rasfcn;
intcon = 1 を設定して整数制約を設定し、最小化を実行します。
intcon = 1;
[x,fval] = surrogateopt(fun,lb,ub,intcon,options);
surrogateopt stopped because it exceeded the function evaluation limit set by
'options.MaxFunctionEvaluations'.
プロットには、surrogateopt が実行不可能なポイントを評価する場所に色付きのマーカーが表示されるようになりました。最終点は[0,0]の真の最小点に近くなります。
disp(x)
   1.0e-04 *

         0    0.6798
整数制約は、探索空間を縮小することで surrogateopt が真の最小値を見つけるのに役立つ可能性があります。
function F = rasfcn(x)
F.Fval = rastriginsfcn(x);
F.Ineq = x(1)^2 - 2 - x(2);
end