Configure Array Plot From the Command-Line
This example shows how to change Array Plot block behavior and appearance from the MATLAB command line.
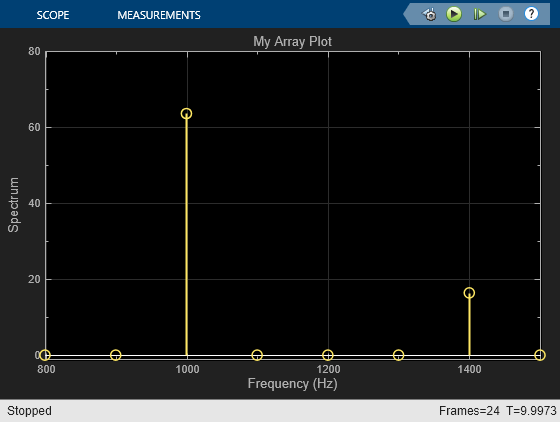
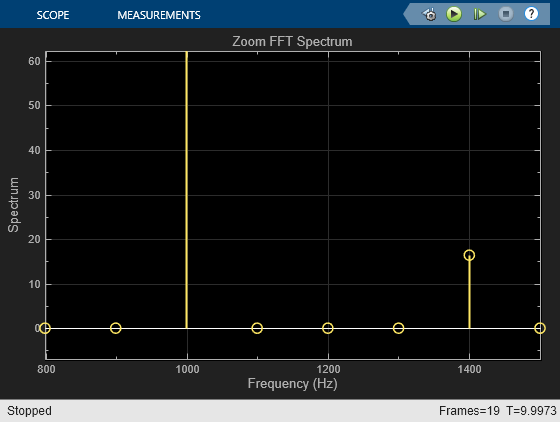
Load the model. Then, change the title of the Array Plot and the axes scaling.
model = 'zoomfftExample';

load_system(model)
sim(model)
open_system([model '/View Spectrum'])
sim(model)
set_param([model '/View Spectrum'],'Title','My Array Plot');
set_param([model '/View Spectrum'],'AxesScaling','Manual');
set_param([model '/View Spectrum'],'YLimits','[-1 80]');
open_system([model '/View Spectrum'])