EEG データ分類のための時間-周波数畳み込みネットワーク
この例では、時間-周波数畳み込みネットワークを使用して、てんかんのある人とない人の脳波 (EEG) 時系列を分類する方法を示します。畳み込みネットワークは、連続ウェーブレット変換 (CWT) に基づいて EEG データのクラスを予測します。この例では、時間-周波数ネットワークと 1 次元畳み込みネットワークを比較します。CWT (スカログラム) の振幅または振幅の 2 乗を前処理ステップとして使用する深層学習ネットワークとは異なり、この例では微分可能なスカログラム層を使用します。ネットワーク内に微分可能なスカログラム層を配置すると、スカログラムの前後に学習可能な演算を配置できます。このタイプの層により、時間-周波数変換で実現可能なアーキテクチャのバリエーションが大幅に広がります。
データ -- 説明、帰属、およびダウンロード手順
この例で使用されるデータは、Bonn EEG データ セットです。データは現在、EEG データ ダウンロードおよび The Bonn EEG time series download page で入手可能です。データの使用に関する法的条件については、The Bonn EEG time series download page を参照してください。この例におけるデータの使用については、著者の方々から快諾いただきました。
この例のデータは、以下の論文で初めて解析、報告されたものです。
データは、100 個の単一チャネル EEG 記録から成る 5 つのセットで構成されています。単一チャネル EEG 記録の選定にあたっては、128 チャネルの EEG 記録から各チャネルの明らかなアーティファクトを目視で検査し、弱い定常性基準を満たしているものを収録しました。詳細についてはリンク先の論文を参照してください。
原著論文では、これら 5 つのセットに対して A ~ E のクラス名が割り当てられています。各記録の持続時間は 23.6 秒で、173.61 Hz でサンプリングされています。各時系列には 4097 個のサンプルが含まれます。条件は次のとおりです。
A — 目を開いた正常な被験者
B — 目を閉じた正常な被験者
C — てんかん患者の発作のない記録。てんかん原生領域の反対側の脳半球にある海馬から得られた記録
D — てんかん患者の発作のない記録。てんかん原生領域から得られた記録。
E — てんかん患者の発作活動を示す記録。
このデータに対応する zip ファイルには、Z.zip (A)、O.zip (B)、N.zip (C)、F.zip (D)、および S.zip (E) というラベルが付けられています。
この例では、zip ファイルをダウンロードし、それぞれ Z、O、N、F、および S という名前のフォルダーに解凍していることを前提としています。MATLAB® では、次の補助関数を使用するか、手動で親フォルダーを作成して、それを unzip コマンドの OUTPUTDIR 変数として使用することでこれを実行できます。この例では、MATLAB が tempdir として指定したフォルダーを親フォルダーとして使用します。別のフォルダーを使用する場合は、それに応じて parentDir の値を調整します。
parentDir = tempdir;
dataDir = fullfile(parentDir,"BonnEEG");
if ~exist(dataDir,"dir")
    mkdir(dataDir)
end
cd(dataDir)
helperDownloadData(dataDir)
学習用データの準備
個々の EEG 時系列は、dataDir の下の Z、N、O、F、および S の各フォルダーに .txt ファイルとして保存されます。tabularTextDatastore を使用してデータを読み取ります。表形式のテキスト データストアを作成し、フォルダー名に基づいて信号ラベルの categorical 配列を作成します。
tds = tabularTextDatastore(dataDir,"IncludeSubfolders",true,"FileExtensions",".txt");
zip ファイルは macOS で作成されました。多くの場合、unzip 関数によって _MACOSX というフォルダーが作成されます。dataDir にこのフォルダーがある場合は、削除します。
extraTXT = contains(tds.Files,"__MACOSX");
tds.Files(extraTXT) = [];
テキスト ファイル名の最初の文字に基づいてデータのラベルを作成します。
labels = filenames2labels(tds.Files,"ExtractBetween",[1 1]);オブジェクト読み取り関数を使用して、データを格納する table を作成します。例で使用されている深層学習ネットワークに準拠するように、信号を行ベクトルの cell 配列として形状変更します。
ii = 1;
eegData = cell(numel(labels),1);
while hasdata(tds)
    tsTable = read(tds);
    eegData{ii} = tsTable.Var1;
    ii = ii+1;
end
reset(tds)
データには 5 つの条件が存在するため、臨床的に意味のある複数の方法でデータを分割できます。関連する方法の 1 つは、Z ラベルと O ラベル (目を開いた状態と閉じた状態の非てんかん患者) を "Normal" (正常) としてグループ化することです。同様に、明らかな発作活動を伴わないてんかん患者に記録された 2 つの状態 (F および N) は、"Pre-seizure" (発作前) としてグループ化できます。最後に、発作活動のあるてんかん患者から得られた記録を "Seizure" (発作) として指定します。
labels3Class = labels;
labels3Class = removecats(labels3Class,["F","N","O","S","Z"]);
labels3Class(labels == categorical("Z") | labels == categorical("O")) = ...
    categorical("Normal");
labels3Class(labels == categorical("F") | labels == categorical("N")) = ...
    categorical("Pre-seizure");
labels3Class(labels == categorical("S")) = categorical("Seizure");
派生させたカテゴリごとに記録数を表示します。要約結果によると、"Seizure" カテゴリには 100 件の記録、"Pre-seizure" と "Normal" カテゴリにはそれぞれ 200 件の記録があり、3 つのクラス間で偏りが見られます。
summary(labels3Class)
     Normal           200
     Pre-seizure      200
     Seizure          100
データを、学習セット、テスト セット、および検証セット (それぞれ記録の 70%、20%、および 10% で構成される) に分割します。
idxSPN = splitlabels(labels3Class,[0.7 0.2 0.1]);
trainDataSPN = eegData(idxSPN{1});
trainLabelsSPN = labels3Class(idxSPN{1});
testDataSPN = eegData(idxSPN{2});
testLabelsSPN = labels3Class(idxSPN{2});
validationDataSPN = eegData(idxSPN{3});
validationLabelsSPN = labels3Class(idxSPN{3});
3 つのセット全体で各条件の割合を調べます。
summary(trainLabelsSPN)
     Normal           140
     Pre-seizure      140
     Seizure           70
summary(validationLabelsSPN)
     Normal           20
     Pre-seizure      20
     Seizure          10
summary(testLabelsSPN)
     Normal           40
     Pre-seizure      40
     Seizure          20
クラス間に偏りがあるため、クラス頻度の逆数に比例する重みを作成して、深層学習モデルの学習で使用します。これにより、モデルがより頻度の高いクラスに偏る傾向が緩和されます。
classwghts = numel(labels3Class)./(3*countcats(labels3Class));
時間-周波数モデルに学習させる前に、各クラスの最初の例の時系列データとスカログラムを検証します。プロットは補助関数 helperExamplePlot によって行われます。
helperExamplePlot(trainDataSPN,trainLabelsSPN)

スカログラムは、EEG 波形などの時系列データ (ゆっくりとした振動現象と一過性の現象の両方が含まれる) に対して理想的な時間-周波数変換です。
時間-周波数深層学習ネットワーク
入力信号の時間-周波数変換を分類に使用するネットワークを定義します。
netSPN = [
    sequenceInputLayer(1,"MinLength",4097,"Name","input","Normalization","zscore")
    convolution1dLayer(5,1,"stride",2)
    cwtLayer("SignalLength",2047,"IncludeLowpass",true,"Wavelet","amor")
    maxPooling2dLayer([5,10])
    convolution2dLayer([5,10],5,"Padding","same")
    maxPooling2dLayer([5,10])
    batchNormalizationLayer
    reluLayer
    convolution2dLayer([5,10],10,"Padding","same")
    maxPooling2dLayer([2,4])
    batchNormalizationLayer
    reluLayer
    flattenLayer
    globalAveragePooling1dLayer
    dropoutLayer(0.4)
    fullyConnectedLayer(3)
    softmaxLayer
    ];
ネットワークには、平均値が 0、標準偏差が 1 となるように信号を正規化する入力層があります。[1] とは異なり、このネットワークでは前処理バンドパス フィルターは使用しません。代わりに、スカログラムを取得する前に、学習可能な 1 次元畳み込み層を使用します。時間次元に沿ってデータのサイズをダウンサンプリングするために、1 次元畳み込み層ではストライド 2 を使用しています。これにより、後続のスカログラムの計算量を軽減しています。次の層cwtLayer (Wavelet Toolbox)は、入力信号のスカログラム (振幅 CWT) を取得します。各入力信号に対して、CWT 層の出力は時間-周波数マップのシーケンスになります。この層は構成可能です。ここでは、解析的 Morlet ウェーブレットを使用し、ローパス スケーリング係数を含めています。このデータの別のスカログラムベースの解析については [3] を参照してください。また、調整可能な Q 係数ウェーブレット変換を使用した別のウェーブレットベースの解析については [2] を参照してください。
スカログラムを取得した後、ネットワークは 2 次元演算を使用してスカログラムの時間次元と周波数次元の両方に沿って処理を行い、flattenLayer に達します。flattenLayer 以降では、モデルは時間軸に沿って出力を平均化し、過適合を防ぐためにドロップアウト層を使用します。全結合層では、チャネル次元に沿って出力をデータ クラス数 (3) に等しくなるように削減します。
少数しか存在しないクラスに対するネットワークの偏りを軽減するため、事前に計算しておいたクラス重みを使用します。予測 Y とターゲット T を受け取り、加重クロスエントロピー損失を返すカスタム損失関数を作成します。
lossFcn = @(Y,T)crossentropy(Y,T,classwghts,...
    NormalizationFactor="all-elements", ...
    WeightsFormat="C");
ネットワーク学習オプションを指定します。検証損失が最良であるネットワークを出力します。
options = trainingOptions("adam", ...
    "MaxEpochs",40, ...
    "MiniBatchSize",20, ...
    "Shuffle","every-epoch",...
    "Plots","training-progress",...
    "ValidationData",{validationDataSPN,validationLabelsSPN},...
    "L2Regularization",1e-2,...
    "OutputNetwork","best-validation-loss",...
    "Verbose", false, ...
    "Metrics","accuracy");
関数trainnetを使用してニューラル ネットワークに学習させます。重み付き分類の場合、カスタム クロスエントロピー関数を使用します。既定では、trainnet 関数は利用可能な GPU がある場合にそれを使用します。GPU での学習には、Parallel Computing Toolbox™ ライセンスとサポートされている GPU デバイスが必要です。サポートされているデバイスの詳細については、GPU 計算の要件 (Parallel Computing Toolbox)を参照してください。そうでない場合、関数 trainnet は CPU を使用します。実行環境を手動で選択するには、ExecutionEnvironment 学習オプションを使用します。
trainedNetSPN = trainnet(trainDataSPN,trainLabelsSPN,netSPN,lossFcn,options);
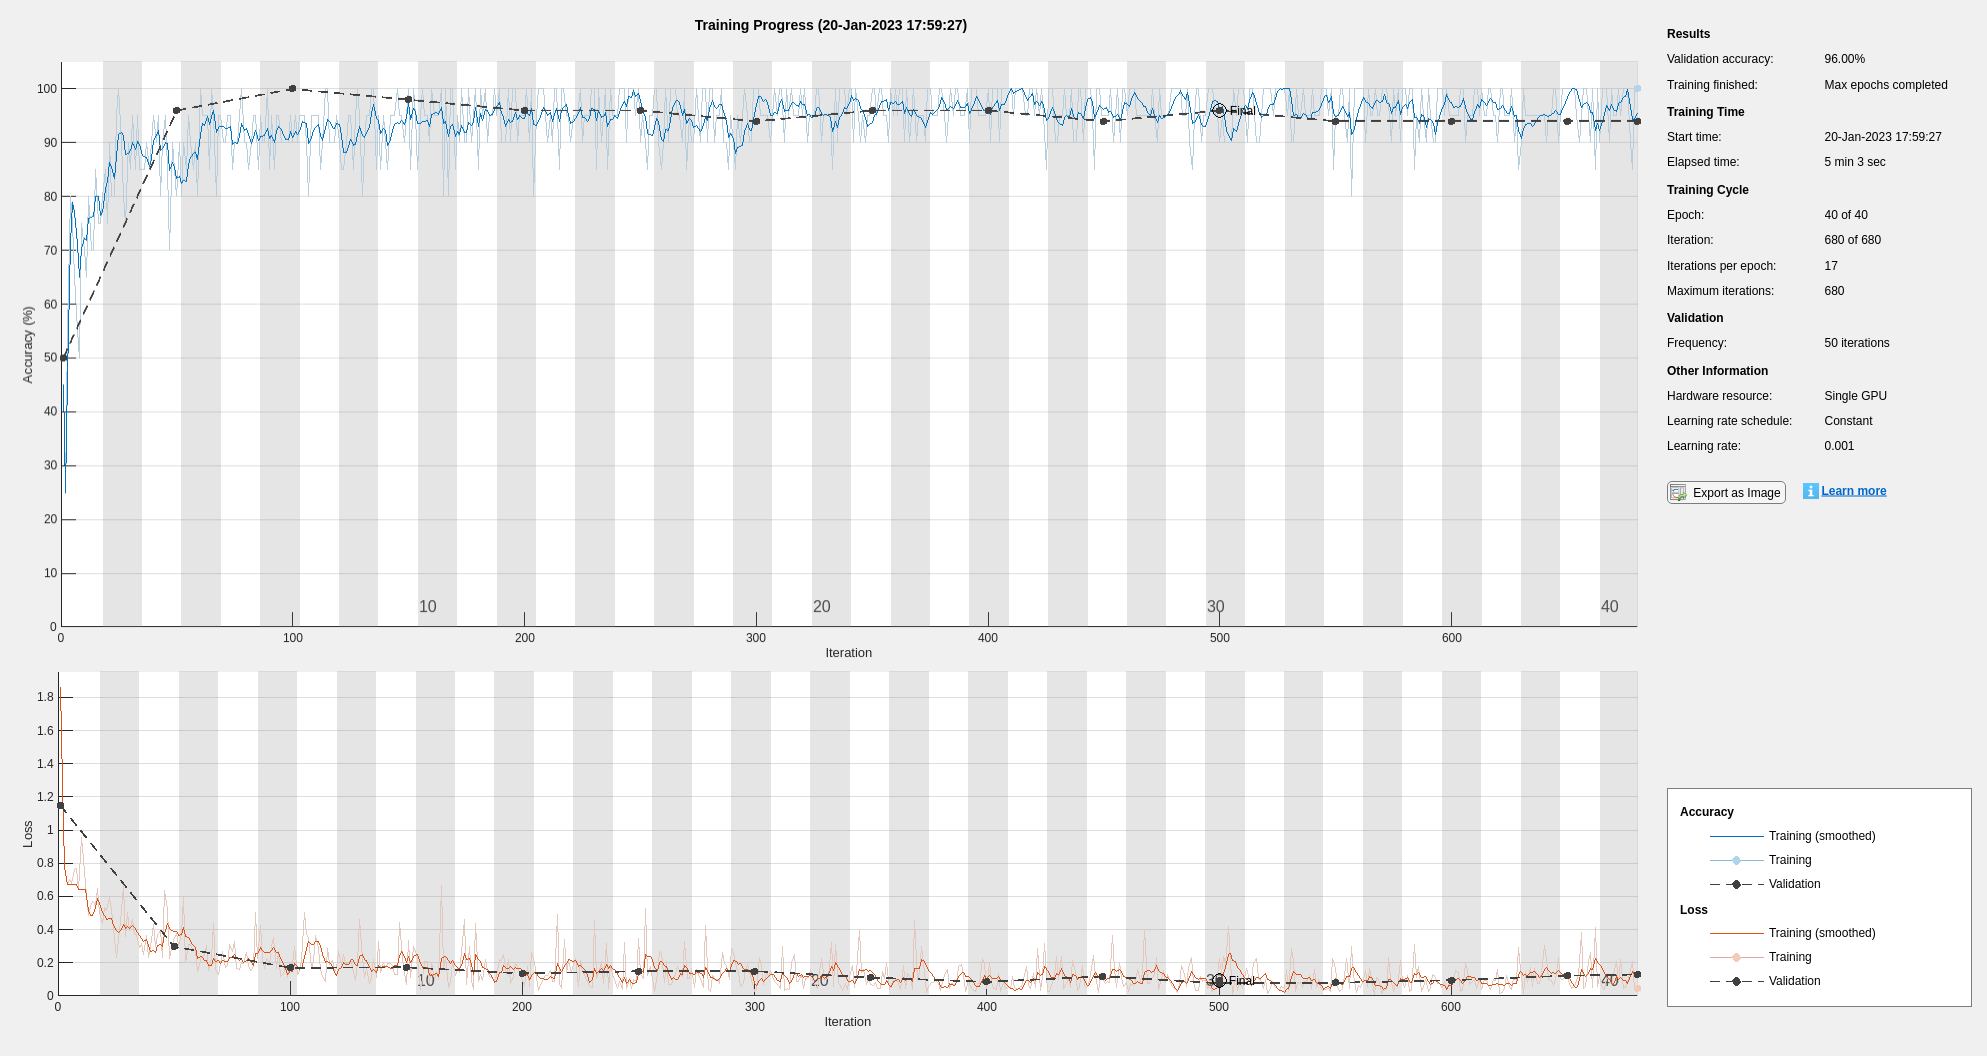
学習において、学習データ セットと検証データ セットの間には良好な一致が見られます。
学習が完了したら、ホールドアウトされたテスト セットでネットワークをテストします。混同チャートをプロットし、ネットワークの再現率と適合率を調べます。
scores = minibatchpredict(trainedNetSPN,testDataSPN);
classNames = unique(testLabelsSPN);
ypredSPN = scores2label(scores,classNames);
sum(ypredSPN == testLabelsSPN)/numel(testLabelsSPN)
ans = 0.9500
hf = figure;
confusionchart(hf,testLabelsSPN,ypredSPN,"RowSummary","row-normalized","ColumnSummary","column-normalized")
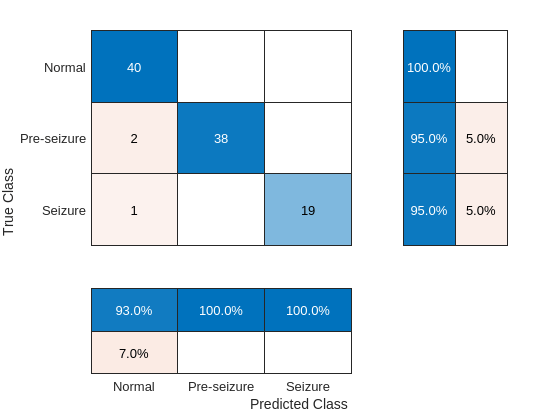
混同チャートはテスト セットでの良好なパフォーマンスを示しています。混同チャートの行の要約はモデルの "再現率" を示し、列の要約は "適合率" を示しています。再現率と適合率はどちらも通常は 95 ~ 100 パーセントの範囲になります。"Seizure" クラスと "Normal" クラスでは、"Pre-seizure" クラスと比較して全般的にパフォーマンスが優れていました。
1 次元畳み込みネットワーク
参考として、時間-周波数深層学習ネットワークのパフォーマンスを、生の時系列を入力として使用する 1 次元畳み込みネットワークと比較します。可能な限り、時間-周波数ネットワークと時間領域ネットワークの間の層は同等性が保たれます。生の時系列データに対して動作可能な深層学習ネットワークにはさまざまなバリエーションがあることに注意してください。この特定のネットワークは評価の基準として含めているのであり、時系列ネットワークのパフォーマンスと時間-周波数ネットワークのパフォーマンスを厳密に比較することを意図したものではありません。
netconvSPN = [sequenceInputLayer(1,"MinLength",4097,"Name","input","Normalization","zscore")
    convolution1dLayer(5,1,"stride",2)
    maxPooling1dLayer(10)
    batchNormalizationLayer
    reluLayer
    convolution1dLayer(5,5,"Padding","same")
    batchNormalizationLayer
    reluLayer
    convolution1dLayer(5,10,"Padding","same")
    maxPooling1dLayer(4)
    batchNormalizationLayer
    reluLayer
    globalAveragePooling1dLayer
    dropoutLayer(0.4)
    fullyConnectedLayer(3)
    softmaxLayer
    ];
trainedNetConvSPN = trainnet(trainDataSPN,trainLabelsSPN,netconvSPN,lossFcn,options);
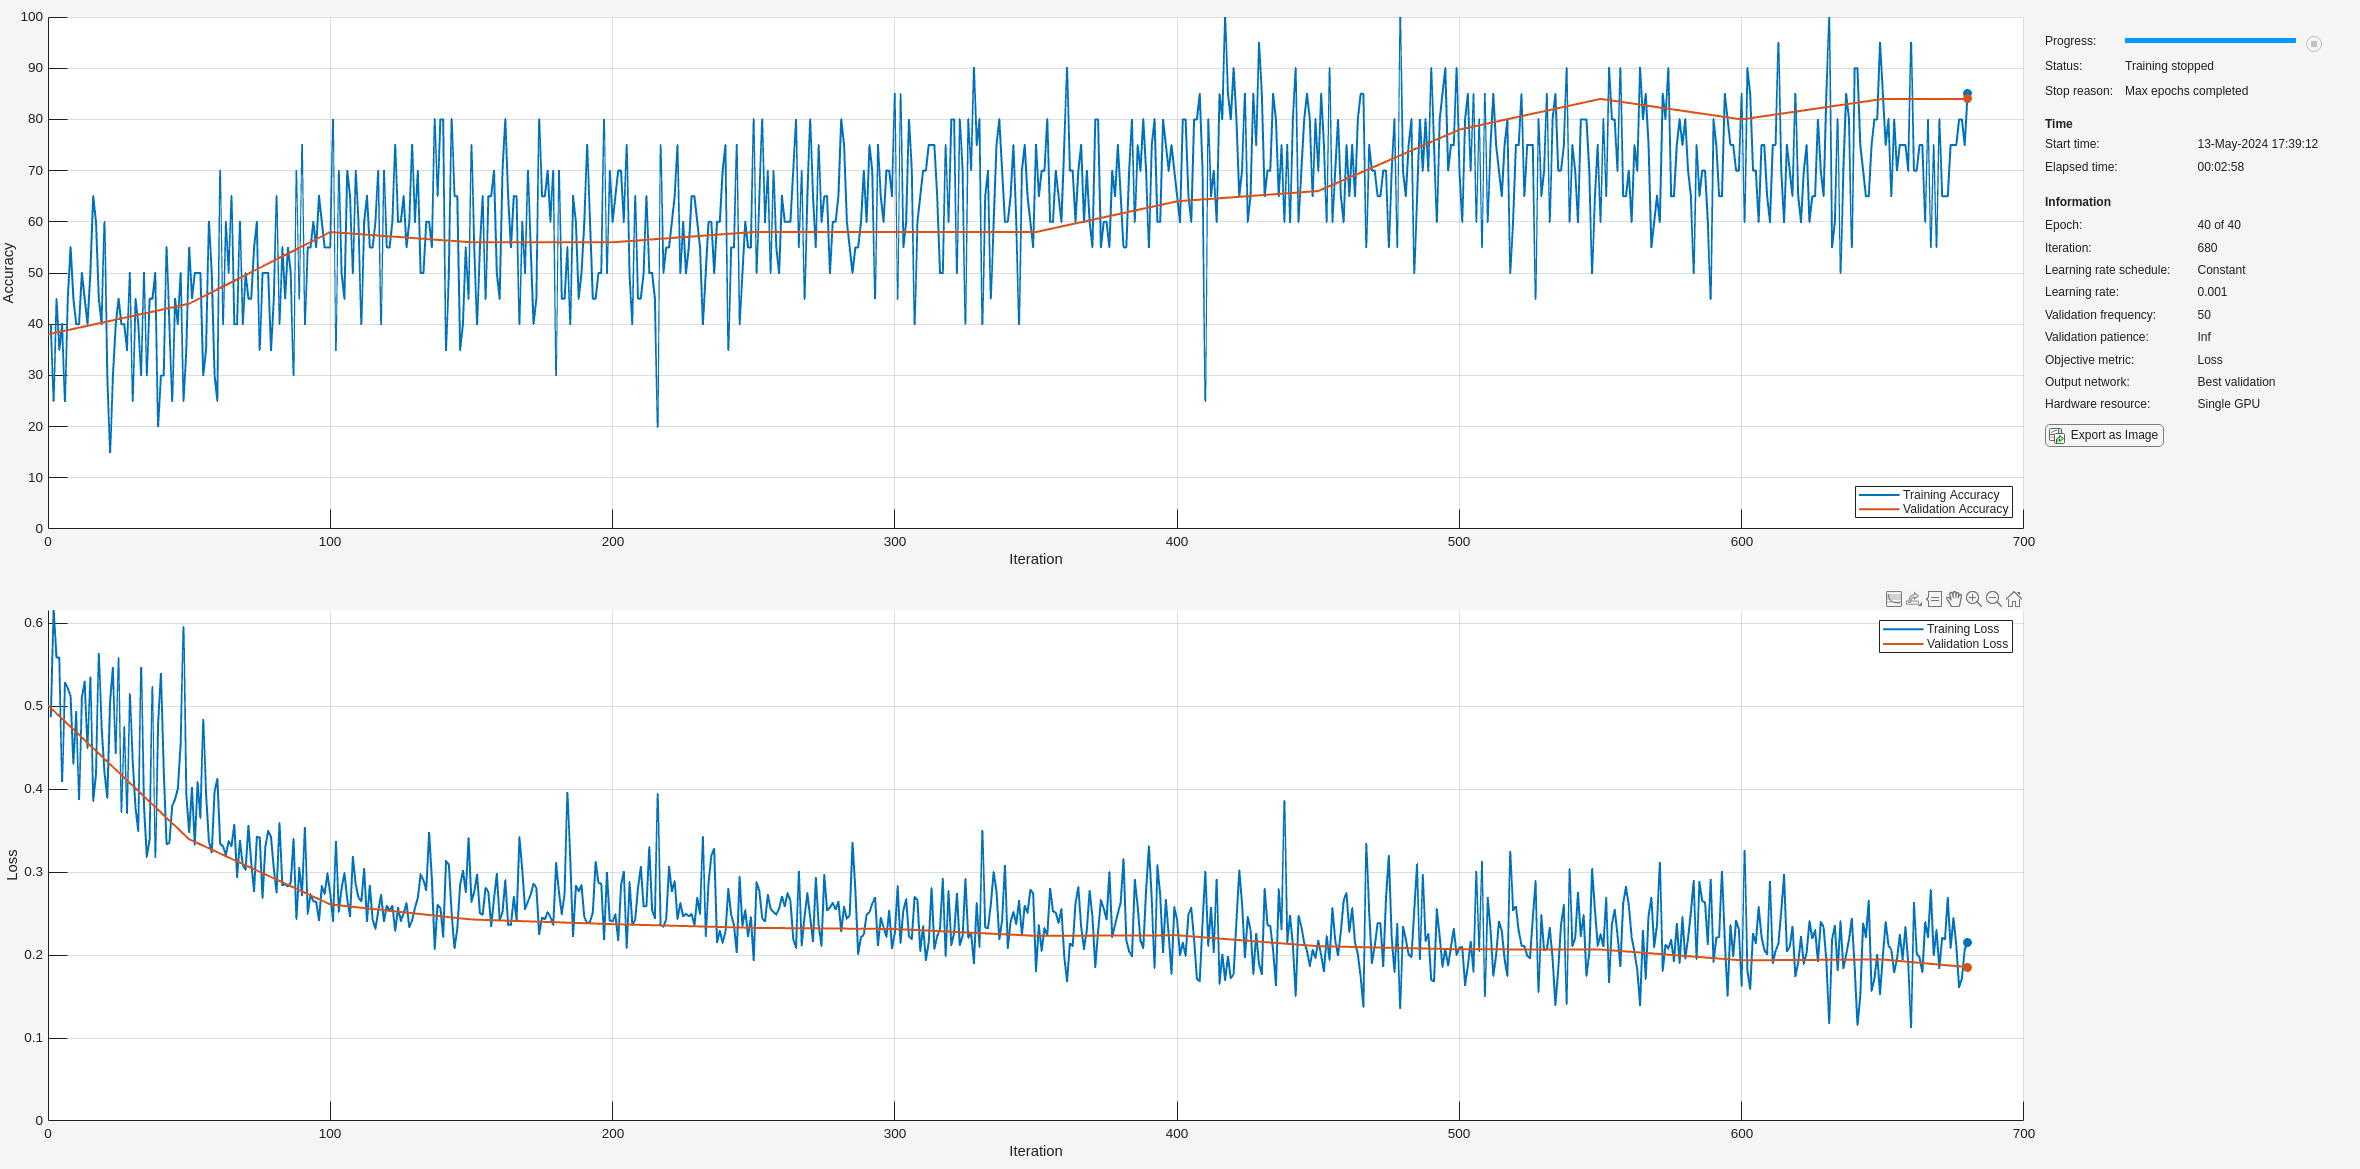
学習において、学習セットと検証セットの精度の間には良好な一致が見られます。しかし、学習中のネットワーク精度は比較的低くなっています。学習が完了したら、ホールドアウトされたテスト セットでモデルをテストします。混同チャートをプロットし、モデルの再現率と適合率を調べます。
scores = minibatchpredict(trainedNetConvSPN,testDataSPN);
ypredconvSPN = scores2label(scores,classNames);
sum(ypredconvSPN == testLabelsSPN)/numel(testLabelsSPN)
ans = 0.7400
hf = figure;
confusionchart(hf,testLabelsSPN,ypredconvSPN,"RowSummary","row-normalized","ColumnSummary","column-normalized")
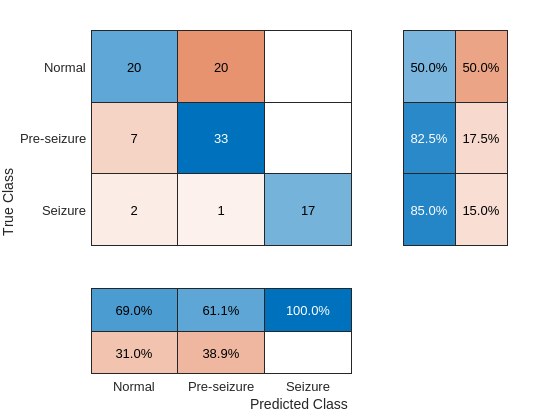
ネットワークの再現率と適合率のパフォーマンスは、予想どおり時間-周波数ネットワークに比べて大幅に精度が劣っています。
発作前と発作の区別
診断上有用な別のデータ分割方法として、てんかん患者のデータのみを解析し、そのデータを発作前データと発作データに分割する方法があります。前のセクションで行ったように、データを学習用、テスト用、および検証用のセット (データの 70%、20%、および 10% の割合) に分割し、"Pre-seizure" と "Seizure" の例とします。まず、データを分割するために新しいラベルを作成します。各クラスの例の数を調べます。
labelsPS = labels;
labelsPS = removecats(labelsPS,["F","N","O","S","Z"]);
labelsPS(labels == categorical("S")) = categorical("Seizure");
labelsPS(labels == categorical("F") | labels == categorical("N")) = categorical("Pre-seizure");
labelsPS(isundefined(labelsPS)) = [];
summary(labelsPS)
     Seizure          100
     Pre-seizure      200
結果として得られるクラスには偏りがあり、"Pre-seizure" カテゴリの信号の数は "Seizure" カテゴリの 2 倍になっています。この偏った分類に対応するため、データを分割し、クラス重みを構成します。
idxPS = splitlabels(labelsPS,[0.7 0.2 0.1]);
trainDataPS = eegData(idxPS{1});
trainLabelsPS = labelsPS(idxPS{1});
testDataPS = eegData(idxPS{2});
testLabelsPS = labelsPS(idxPS{2});
validationDataPS = eegData(idxPS{3});
validationLabelsPS = labelsPS(idxPS{3});
classwghts = numel(labelsPS)./(2*countcats(labelsPS));
前の解析と同じ畳み込みネットワークを使用し、クラス数の違いに応じて全結合層のみ変更します。
netPS = [sequenceInputLayer(1,"MinLength",4097,"Name","input","Normalization","zscore")
    convolution1dLayer(5,1,"stride",2)
    cwtLayer("SignalLength",2047,"IncludeLowpass",true,"Wavelet","amor")
    averagePooling2dLayer([5,10])
    convolution2dLayer([5,10],5,"Padding","same")
    maxPooling2dLayer([5,10])
    batchNormalizationLayer
    reluLayer
    convolution2dLayer([5,10],10,"Padding","same")
    maxPooling2dLayer([2,4])
    batchNormalizationLayer
    reluLayer
    flattenLayer
    globalAveragePooling1dLayer
    dropoutLayer(0.4)
    fullyConnectedLayer(2)
    softmaxLayer
    ];
ネットワークに学習をさせます。
options = trainingOptions("adam", ...
    "MaxEpochs",40, ...
    "MiniBatchSize",32, ...
    "Shuffle","every-epoch",...
    "Plots","training-progress",...
    "ValidationData",{validationDataPS,validationLabelsPS},...
    "L2Regularization",1e-2,...
    "OutputNetwork","best-validation-loss",...
    "Verbose", false, ...
    "Metrics","accuracy");

lossFcn = @(Y,T)crossentropy(Y,T,classwghts,...
    NormalizationFactor="all-elements", ...
    WeightsFormat="C");

trainedNetPS = trainnet(trainDataPS,trainLabelsPS,netPS,lossFcn,options);
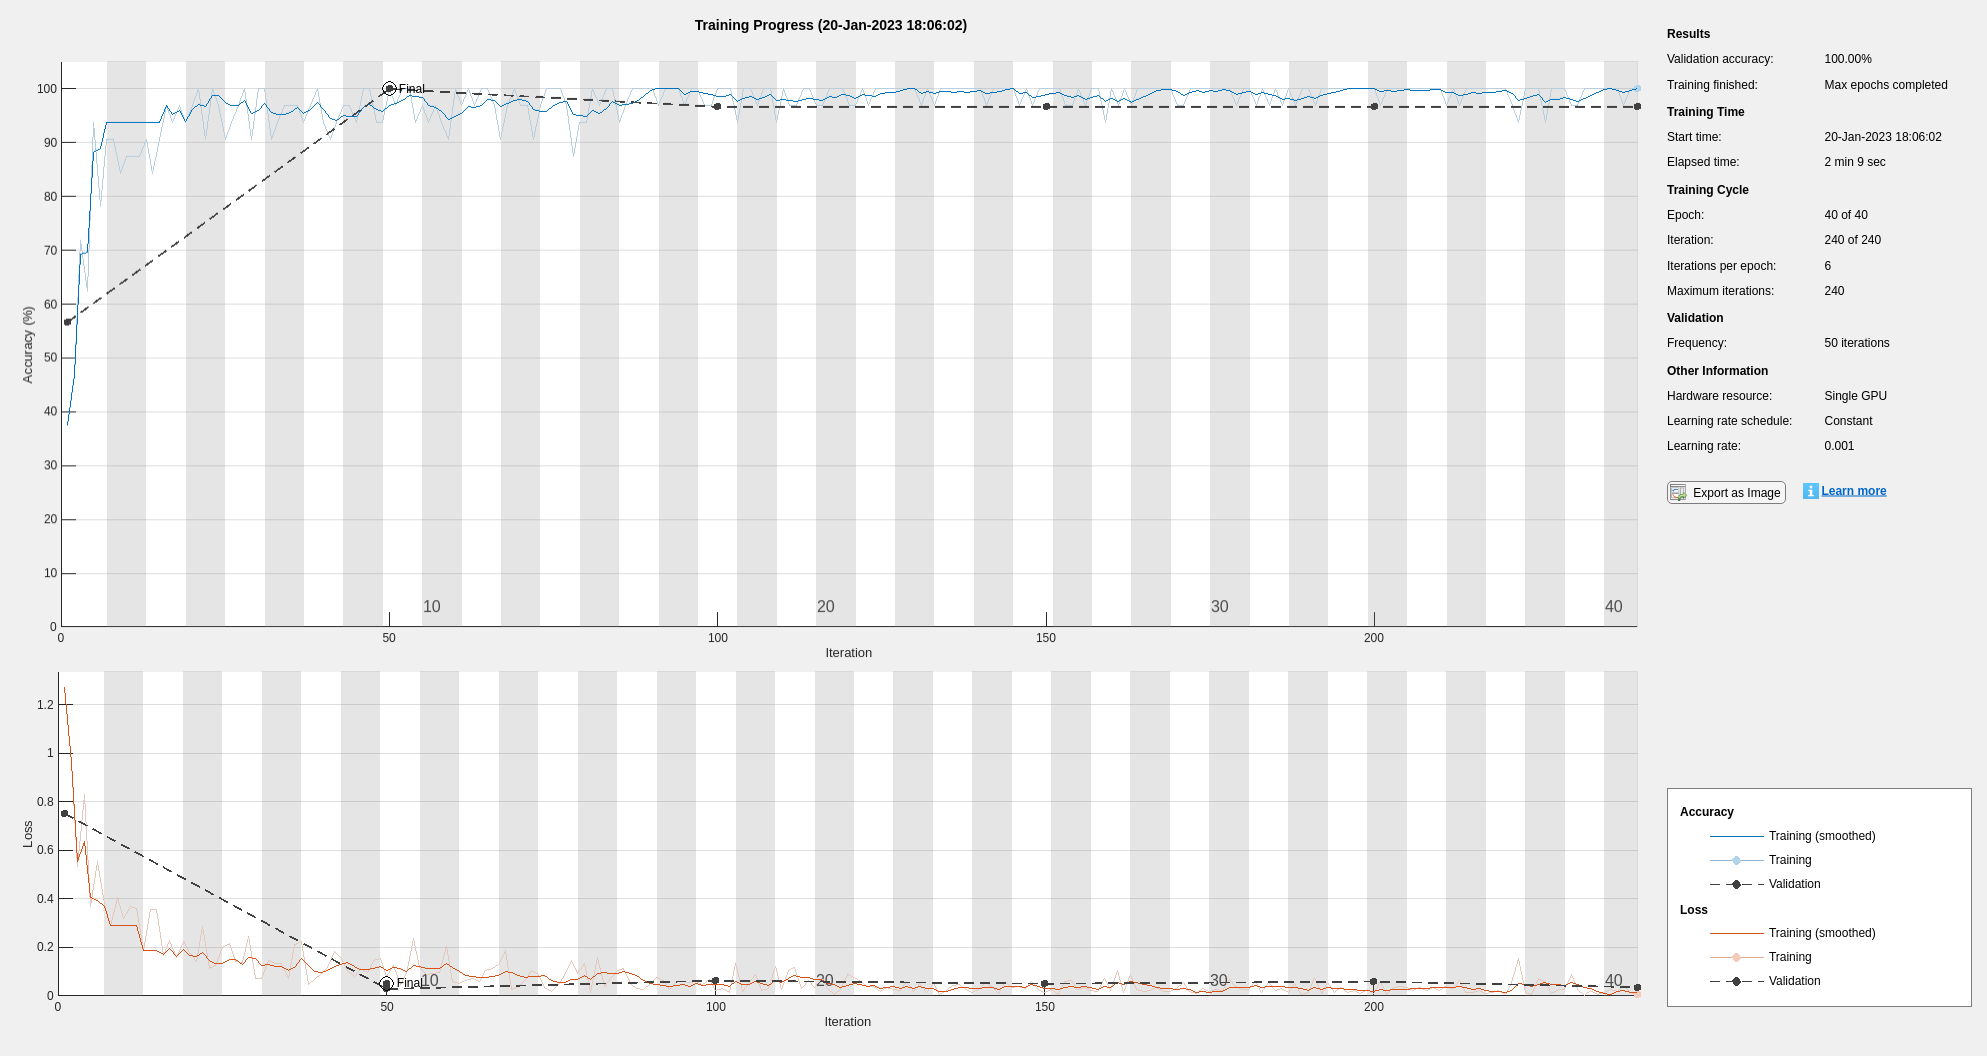
テスト セットの精度を調べます。
scores = minibatchpredict(trainedNetPS,testDataPS);
classNames = categories(trainLabelsPS);
ypredPS = scores2label(scores,classNames);
sum(ypredPS == testLabelsPS)/numel(testLabelsPS)
ans = 0.9833
hf = figure;
confusionchart(hf,testLabelsPS,ypredPS,"RowSummary","row-normalized","ColumnSummary","column-normalized")
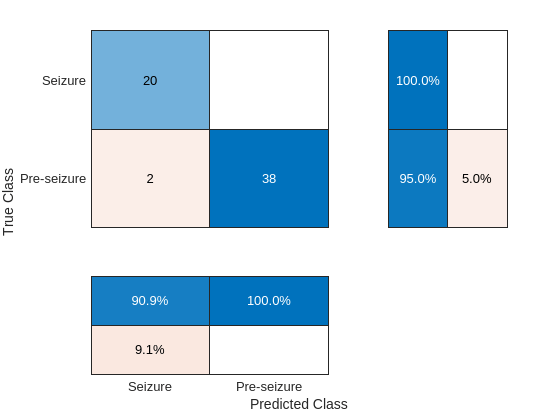
時間-周波数畳み込みネットワークは、"Pre-seizure" のデータと "Seizure" のデータの比較において優れたパフォーマンスを示します。
まとめ
この例では、時間-周波数畳み込みネットワークを使用して、てんかん患者と非てんかん患者の EEG 記録を分類しました。この例と [3] で使用されているスカログラム ネットワークとの決定的な違いは、深層学習モデル内部に微分可能なスカログラムを使用した点にあります。この柔軟性により、同じモデル内で 1 次元と 2 次元の深層学習層を組み合わせることができるだけでなく、時間-周波数変換の前に学習可能な演算を配置することも可能になります。このアプローチを、類似の 1 次元畳み込みネットワークと比較しました。1 次元畳み込みネットワークは、時間-周波数モデルに可能な限り近くなるように構築しました。このデータに対しては、より最適化された 1 次元畳み込みネットワークや再帰ネットワークを設計できる可能性があります。前述のように、この例の焦点は、実際の EEG データに対して微分可能な時間-周波数ネットワークを構築することであり、時間-周波数モデルと競合する時系列モデルとの詳細な比較を行うことではありません。
参考文献
[1] Andrzejak, Ralph G., Klaus Lehnertz, Florian Mormann, Christoph Rieke, Peter David, and Christian E. Elger. “Indications of Nonlinear Deterministic and Finite-Dimensional Structures in Time Series of Brain Electrical Activity: Dependence on Recording Region and Brain State.” Physical Review E 64, no. 6 (2001). https://doi.org/10.1103/physreve.64.061907.
[2] Bhattacharyya, Abhijit, Ram Pachori, Abhay Upadhyay, and U. Acharya. “Tunable-Q Wavelet Transform Based Multiscale Entropy Measure for Automated Classification of Epileptic EEG Signals.” Applied Sciences 7, no. 4 (2017): 385. https://doi.org/10.3390/app7040385.
[3] Türk, Ömer, and Mehmet Siraç Özerdem. “Epilepsy Detection by Using Scalogram Based Convolutional Neural Network from EEG Signals.” Brain Sciences 9, no. 5 (2019): 115. https://doi.org/10.3390/brainsci9050115.
function helperExamplePlot(trainDataSPN,trainLabelsSPN)
% This function is for example use only. It may be changed or
% removed in a future release.
    szidx = find(trainLabelsSPN == categorical("Seizure"),1,"first");
    psidx = find(trainLabelsSPN == categorical("Pre-seizure"),1,"first");
    nidx = find(trainLabelsSPN == categorical("Normal"),1,"first");
    Fs = 173.61;
    t = 0:1/Fs:(4097*1/Fs)-1/Fs;
    [scSZ,f] = cwt(trainDataSPN{szidx},Fs,"amor");
    scSZ = abs(scSZ);
    scPS = abs(cwt(trainDataSPN{psidx},Fs,"amor"));
    scN = abs(cwt(trainDataSPN{nidx},Fs,"amor"));
    tiledlayout(3,2)
    nexttile
    plot(t,trainDataSPN{szidx}), axis tight
    title("Seizure EEG")
    ylabel("Amplitude")
    nexttile
    surf(t,f,scSZ), shading interp, view(0,90)
    set(gca,"Yscale","log"), axis tight
    title("Scalogram -- Seizure EEG")
    ylabel("Hz")
    nexttile
    plot(t,trainDataSPN{psidx}),axis tight
    title("Pre-seizure EEG")
    ylabel("Amplitude")
    nexttile
    surf(t,f,scPS), shading interp, view(0,90)
    set(gca,"Yscale","log"),axis tight
    title("Scalogram -- Pre-seizure EEG")
    ylabel("Hz")
    nexttile
    plot(t,trainDataSPN{nidx}), axis tight
    title("Normal EEG")
    ylabel("Amplitude")
    xlabel("Time (Seconds)")
    nexttile
    surf(t,f,scN), shading interp, view(0,90)
    set(gca,"Yscale","log"),axis tight
    title("Scalogram -- Normal EEG")
    ylabel("Hz")
    xlabel("Time (Seconds)")
end

function helperDownloadData(dataDir)
% This function is for example use only. It may be changed or
% removed in a future release.
fileList = ["Z","O","N","F","S"];
zipFiles = dir(fullfile(dataDir, '*.zip'));
if ~all(ismember(fileList+".zip", {zipFiles.name}))
    try
        websave(fullfile(dataDir,"/Z.zip"), "https://www.upf.edu/documents/229517819/234490509/Z.zip/9c4a0084-c0d6-3cf6-fe48-8a8767713e67");
        websave(fullfile(dataDir,"/O.zip"), "https://www.upf.edu/documents/229517819/234490509/O.zip/f324f98f-1ade-e912-b89d-e313ac362b6a");
        websave(fullfile(dataDir,"/N.zip"), "https://www.upf.edu/documents/229517819/234490509/N.zip/d4f08e2d-3b27-1a6a-20fe-96dcf644902b");
        websave(fullfile(dataDir,"/F.zip"), "https://www.upf.edu/documents/229517819/234490509/F.zip/8219dcdd-d184-0474-e0e9-1ccbba43aaee");
        websave(fullfile(dataDir,"/S.zip"), "https://www.upf.edu/documents/229517819/234490509/S.zip/7647d3f7-c6bb-6d72-57f7-8f12972896a6");
    catch
        error("Unable to download data automatically. Download data from website maunnally.")
    end
end
for file = fileList
    unzip(file+".zip",fullfile(dataDir,file))
    delete(file+".zip")
end
end
参考
関数
dlcwt(Wavelet Toolbox) |cwtfilters2array(Wavelet Toolbox) |cwt(Wavelet Toolbox)
オブジェクト
cwtLayer(Wavelet Toolbox) |cwtfilterbank(Wavelet Toolbox)