Main Content

このページの内容は最新ではありません。最新版の英語を参照するには、ここをクリックします。

integrate

cfit オブジェクトの積分

説明

int = integrate(fun,x,x0) は、cfit オブジェクト funx0 から開始されるベクトル x で指定した点で積分し、その結果を int に返します。

すべて折りたたむ

ベースラインの正弦波信号を作成します。

xdata = (0:.1:2*pi)';
y0 = sin(xdata);

応答依存ガウス ノイズを信号に付加します。

noise = 2*y0.*randn(size(y0));
ydata = y0 + noise;

ノイズを含むデータにカスタムの正弦波モデルを当てはめます。

f = fittype('a*sin(b*x)');
fit1 = fit(xdata,ydata,f,'StartPoint',[1 1]);

予測子値について近似の積分を求めます。

int = integrate(fit1,xdata,0);
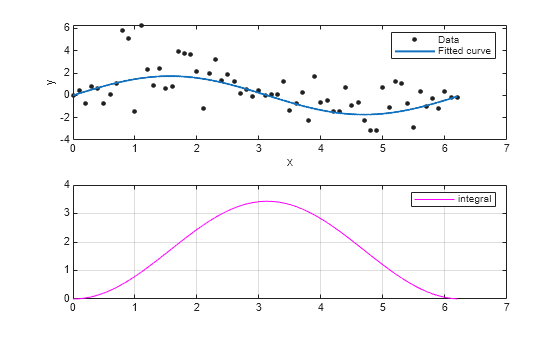
データ、近似、積分をプロットします。

subplot(2,1,1)
plot(fit1,xdata,ydata) % cfit plot method
subplot(2,1,2)
plot(xdata,int,'m') % double plot method
grid on
legend('integral')

Figure contains 2 axes objects. Axes object 1 with xlabel x, ylabel y contains 2 objects of type line. One or more of the lines displays its values using only markers These objects represent data, fitted curve. Axes object 2 contains an object of type line. This object represents integral.

また、cfit plot メソッドを使用して積分を直接計算しプロットすることもできます。

figure
plot(fit1,xdata,ydata,{'fit','integral'})

Figure contains 2 axes objects. Axes object 1 with xlabel x, ylabel y contains 2 objects of type line. One or more of the lines displays its values using only markers These objects represent data, fitted curve. Axes object 2 with xlabel x contains an object of type line. This object represents integral from 0 to x.

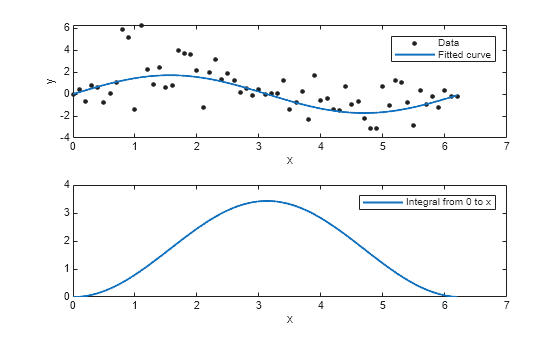
ただし、plot メソッドは積分のデータを返しません。

入力引数

すべて折りたたむ

積分する関数。cfit オブジェクトとして指定します。

関数を積分する点。数値ベクトルとして指定します。

積分の下限。数値スカラーとして指定します。

出力引数

すべて折りたたむ

積分の結果。x と同じサイズの数値ベクトルとして返されます。

バージョン履歴

R2006a より前に導入