メインコンテンツ

plot

サイト ビューアーで RF 伝播データを表示

説明

plot(pd) は、指定された伝播データ オブジェクトからのデータを現在のサイト ビューアーで表示します。この関数は、対応する値に応じて色付けされる円形マーカーとして各データ点を表示します。

plot(___,Name=Value) は、名前と値の引数を使用してオプションを指定します。

すべて折りたたむ

Manhattan のベースマップおよび建物ファイルを使用してサイト ビューアーを起動します。OpenStreetMap® ファイルの詳細については、[1] を参照してください。

viewer = siteviewer("Basemap","streets_dark",...
        "Buildings","manhattan.osm");
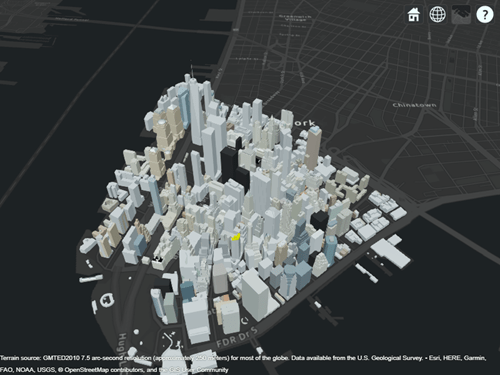
建物の上に送信機サイトを表示します。

tx = txsite("Latitude",40.7107,...
        "Longitude",-74.0114,...
        "AntennaHeight",80);
show(tx)

近くの道に沿って受信機サイトを作成します。

latitude = [linspace(40.7088, 40.71416, 50), ...
        linspace(40.71416, 40.715505, 25), ...
        linspace(40.715505, 40.7133, 25), ...
        linspace(40.7133, 40.7143, 25)]';
longitude = [linspace(-74.0108, -74.00627, 50), ...
        linspace(-74.00627 ,-74.0092, 25), ...
        linspace(-74.0092, -74.0110, 25), ...
        linspace(-74.0110, -74.0132, 25)]';
rxs = rxsite("Latitude", latitude, "Longitude", longitude);

各受信機の位置での信号強度を計算します。

signalStrength = sigstrength(rxs, tx)';

計算された信号強度データを保持する propagationData オブジェクトを作成します。

tbl = table(latitude, longitude, signalStrength);
pd = propagationData(tbl);

信号強度データを色付きの点としてマップ上にプロットします。

legendTitle = "Signal" + newline + "Strength" + newline + "(dB)";
plot(pd, "LegendTitle", legendTitle, "Colormap", parula);

付録

[1] OpenStreetMap ファイルは、クラウドソーシングによる世界中の地図データへのアクセスを提供する https://www.openstreetmap.org からダウンロードされたものです。このデータは Open Data Commons Open Database License (ODbL) https://opendatacommons.org/licenses/odbl/ によりライセンスされています。

入力引数

すべて折りたたむ

伝播データ。propagationData オブジェクトとして指定します。

名前と値の引数

すべて折りたたむ

オプションの引数のペアを Name1=Value1,...,NameN=ValueN として指定します。ここで、Name は引数名で、Value は対応する値です。名前と値の引数は他の引数の後に指定しなければなりませんが、ペアの順序は重要ではありません。

例: plot(pd,Type="power") はタイプを "power" として指定します。

R2021a より前では、コンマを使用して名前と値をそれぞれ区切り、Name を引用符で囲みます。

例: plot(pd,"Type","power") はタイプを "power" として指定します。

プロットするデータ変数。文字ベクトルまたは string スカラーとして指定します。データ変数は、propagationData オブジェクトの作成に使用される table の変数名に対応していなければなりません。既定値は、propagationData オブジェクトの DataVariableName プロパティに対応します。

データ型: char | string

プロットする値のタイプ。"custom""power""efield""sinr"、または "pathloss" として指定します。次の表に、各タイプの既定の色の範囲と凡例のタイトルを示します。

種類色の範囲凡例のタイトル
"custom"[min(Data) max(Data)]''
"power"[-120 -5]電力 (dBm)
"efield"[20 135]電界 (dBuV/m)
"sinr"[-5 20]SINR (dB)
"pathloss"[45 160]パス損失 (dB)

データ型: char | string

プロットするデータ値のレベル。数値ベクトルとして指定します。この関数は、この引数を使用して伝播データをビン化します。この関数は、プロット時、Colors 引数が指定されている場合はこの引数を使用してビンの色を選択し、そうでない場合は Colormap 引数および ColorLimits 引数を使用してビンの色を選択します。この関数は、最小レベルより小さい値をもつデータ点を表示しません。

データ型: double

データ点の色。RGB 3 成分から成る M 行 3 列の配列、string スカラーの配列、または文字ベクトルの cell 配列として指定します。この関数は、Levels 引数で指定された対応する値に色を割り当てます。

Colors 引数を Colormap 引数または ColorLimits 引数と組み合わせることはできません。

データ型: double | char | string

点を色付けするためのカラーマップ。カラーマップ名として指定するか、M 個の個別の色を定義する RGB 3 成分から成る M 行 3 列の配列として指定します。

次の表はカラーマップ名の一覧です。

カラーマップ名カラー スケール

parula

Colorbar showing the colors of the parula colormap. The colormap starts at dark blue and transitions to lighter blue, green, orange and yellow. The transitions between colors are more perceptually uniform than in most other colormaps.

turbo

Colorbar showing the colors of the turbo colormap. The colormap starts at dark blue and transitions to lighter blue, bright green, orange, yellow, and dark red. This colormap is similar to jet, but the transitions between colors are more perceptually uniform than in jet.

hsv

Colorbar showing the colors of the hsv colormap. The colormap starts at red and transitions to yellow, bright green, cyan, dark blue, magenta, and bright orange.

hot

Colorbar showing the colors of the hot colormap. The colormap starts at dark red and transitions to bright red, orange, yellow, and white.

cool

Colorbar showing the colors of the cool colormap. The colormap starts at cyan and transitions to light blue, light purple, and magenta.

spring

Colorbar showing the colors of the spring colormap. The colormap starts at magenta and transitions to pink, light orange, and yellow.

summer

Colorbar showing the colors of the summer colormap. The colormap starts at medium green and transitions to yellow.

autumn

Colorbar showing the colors of the autumn colormap. The colormap starts at bright orange and transitions to yellow.

winter

Colorbar showing the colors of the winter colormap. The colormap starts at dark blue and transitions to bright green.

gray

Colorbar showing the gray colormap. The colormap starts at black and transitions to white.

bone

Colorbar showing the bone colormap. This colormap has colors that are approximately gray with a slight blue color tint. The colormap starts at dark gray and transitions to white.

copper

Colorbar showing the copper colormap. This colormap starts at black and transitions to a medium orange, similar to the color of copper.

pink

Colorbar showing the pink colormap. This colormap starts at dark red and transitions to dark pink, tan, and white.

sky (R2023a 以降)

Colorbar showing the sky colormap. This colormap starts at a very light shade of blue and transitions to a darker shade of blue.

abyss (R2023b 以降)

Colorbar showing the abyss colormap. This colormap starts at a very dark shade of blue and transitions to a lighter shade of blue.

nebula (R2025a 以降)

Colorbar showing the nebula colormap. This colormap starts at a medium shade of blue and transitions to a bright shade of red.

jet

Colorbar showing the colors of the jet colormap. The colormap starts at dark blue and transitions to light blue, bright green, orange, yellow, and dark red.

lines

Colorbar showing the colors of the lines colormap. The colormap contains a repeating pattern of colors: dark blue, dark orange, dark yellow, dark purple, medium green, light blue, and dark red.

colorcube

Colorbar showing the colors of the colorcube colormap. The colormap is a course sampling of the RGB colorspace.

prism

Colorbar showing the colors of the prism colormap. The colormap contains a repeating pattern of colors: red, orange, yellow, green, blue, and purple.

flag

Colorbar showing the colors of the flag colormap. The colormap contains a repeating pattern of colors: red, white, blue, and black.

white

Colorbar showing the white colormap, which is entirely white.

Colormap 引数を Colors 引数と一緒に使用することはできません。

データ型: double | char | string

カラーマップの色の範囲。[min max] 形式の 2 要素ベクトルとして指定します。色の範囲は、カラーマップの最初と最後の色にマッピングされるデータ レベル値を示します。

ColorLimits 引数を Colors 引数と一緒に使用することはできません。

データ型: double

マップにプロットされるデータ マーカーのサイズ。正の数値スカラー (ピクセル単位) として指定します。

データ型: double

マップへの色の凡例の表示。true または false として指定します。

データ型: logical

色の凡例のタイトル。文字ベクトルまたは string スカラーとして指定します。

データ型: string | char

表面データのマップ。siteviewer オブジェクトとして指定します。 1 既定値は現在のサイト ビューアーであり、何も開かれていない場合は新しいサイト ビューアーです。

データ型: char | string

バージョン履歴

R2020a で導入

参考

関数

オブジェクト


1 Alignment of boundaries and region labels are a presentation of the feature provided by the data vendors and do not imply endorsement by MathWorks®.