このページは前リリースの情報です。該当の英語のページはこのリリースで削除されています。
シミュレーション範囲に基づく固定小数点データ型の推奨
この例では、MATLAB® Coder™ アプリを使用してシミュレーション範囲データに基づいて固定小数点データ型を推奨する方法を示します。
必要条件
この例には次の製品が必要です。
MATLAB
MATLAB Coder
Fixed-Point Designer™
C コンパイラ
サポートされるコンパイラ を参照してください。
mex -setupを使用して既定のコンパイラを変更できます。既定のコンパイラの変更を参照してください。
新規フォルダーの作成と関連ファイルのコピー
ローカルの書き込み可能なフォルダーに、関数
ex_2ndOrder_filter.mを作成します。function y = ex_2ndOrder_filter(x) %#codegen persistent z if isempty(z) z = zeros(2,1); end % [b,a] = butter(2, 0.25) b = [0.0976310729378175, 0.195262145875635, 0.0976310729378175]; a = [1, -0.942809041582063, 0.3333333333333333]; y = zeros(size(x)); for i = 1:length(x) y(i) = b(1)*x(i) + z(1); z(1) = b(2)*x(i) + z(2) - a(2) * y(i); z(2) = b(3)*x(i) - a(3) * y(i); end end
テスト ファイル
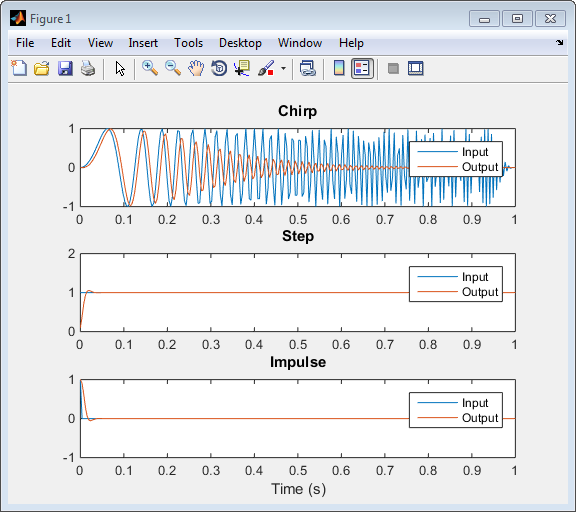
ex_2ndOrder_filter_test.mを作成してex_2ndOrder_filterアルゴリズムの演習を行います。意図したシステムの動作範囲全体をカバーするため、このテスト スクリプトは関数
ex_2ndOrder_filterを 3 つの入力信号、チャープ、ステップ、インパルスを使用して実行します。次に、スクリプトは出力をプロットします。% ex_2ndOrder_filter_test % % Define representative inputs N = 256; % Number of points t = linspace(0,1,N); % Time vector from 0 to 1 second f1 = N/2; % Target frequency of chirp set to Nyquist x_chirp = sin(pi*f1*t.^2); % Linear chirp from 0 to Fs/2 Hz in 1 second x_step = ones(1,N); % Step x_impulse = zeros(1,N); % Impulse x_impulse(1) = 1; % Run the function under test x = [x_chirp;x_step;x_impulse]; y = zeros(size(x)); for i = 1:size(x,1) y(i,:) = ex_2ndOrder_filter(x(i,:)); end % Plot the results titles = {'Chirp','Step','Impulse'} clf for i = 1:size(x,1) subplot(size(x,1),1,i) plot(t,x(i,:),t,y(i,:)) title(titles{i}) legend('Input','Output') end xlabel('Time (s)') figure(gcf) disp('Test complete.')
| 種類 | 名前 | 説明 |
|---|---|---|
| 関数のコード | ex_2ndOrder_filter.m | エントリポイントの MATLAB 関数 |
| テスト ファイル | ex_2ndOrder_filter_test.m | ex_2ndOrder_filter.m をテストする MATLAB スクリプト |
MATLAB Coder アプリを開く
この例で使用するファイルを含む作業フォルダーに移動します。
MATLAB ツールストリップの [アプリ] タブの [コード生成] の下で、アプリ アイコンをクリックします。
ソース ファイルの選択
プロジェクトにエントリポイント関数 ex_2ndOrder_filter を追加するために、ファイル ex_2ndOrder_filter.m を探して [開く] をクリックします。既定では、アプリはこのプロジェクトの情報および設定を現在のフォルダーの ex_2ndOrder_filter.prj というファイルに保存します。
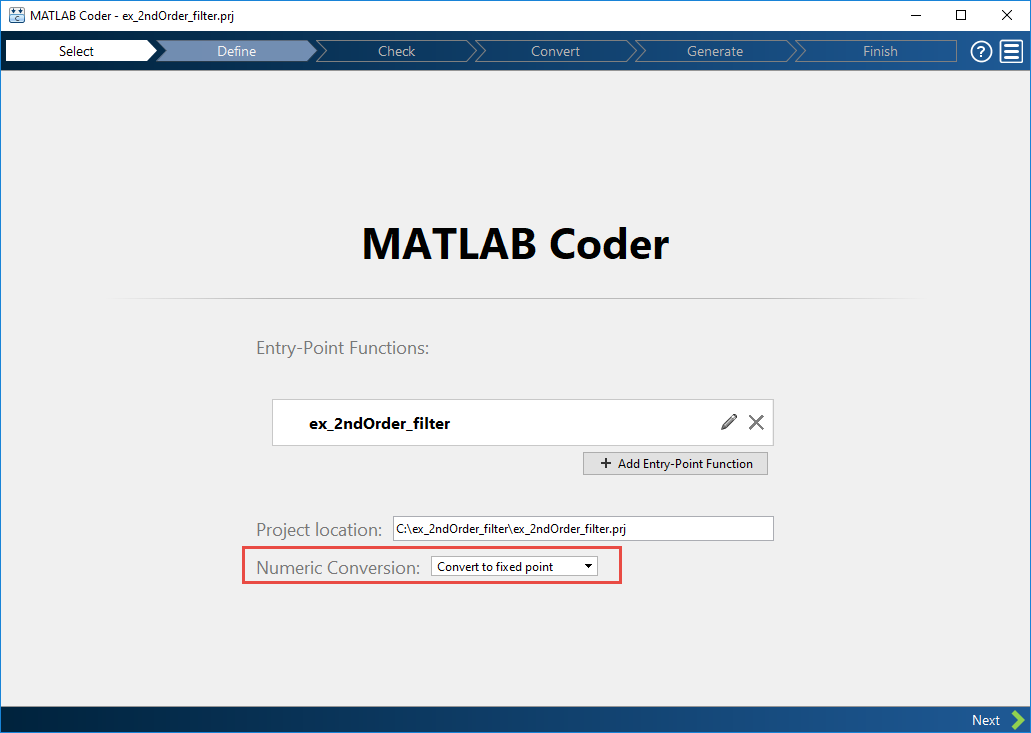
固定小数点変換の有効化
[数値変換] を
[固定小数点に変換]に設定します。
[次へ] をクリックして [入力の型を定義] ステップに進みます。
ex_2ndOrder_filter.mのコード違反およびコード生成の準備状態の問題が検査されます。ex_2ndOrder_filter.mには問題は検出されません。
入力の型の定義
[入力の型を定義] ページで、
ex_2ndOrder_filter_testをテスト ファイルとして追加するためにex_2ndOrder_filter_testを参照して [開く] をクリックします。[入力の型の自動定義] をクリックします。
テスト ファイルが実行され、各入力信号のフィルターの出力が表示されます。

アプリはテスト ファイルから、
xの入力型をdouble(1x256)とすることを決定します。
[次へ] をクリックして [実行時の問題の確認] ステップに進みます。
実行時の問題の確認
[実行時の問題の確認] ステップでインストルメント化された MEX 関数が生成されます。ex_2ndOrder_filter の呼び出しを生成された MEX 関数の呼び出しで置き換えたうえで、テスト ファイル ex_2ndOrder_filter_test が実行されます。アプリが問題を検出した場合には警告およびエラー メッセージが出力されます。メッセージをクリックするとウィンドウ内の問題のあるコードが強調表示され、ここでコードを編集できます。
[実行時の問題の確認] ページでは、入力の型を定義するために使用したテスト ファイル
ex_2ndOrder_filter_testが、アプリによってテスト ファイルのフィールドに入力されます。[問題の確認] をクリックします。
アプリは問題を検出しません。
[次へ] をクリックして [固定小数点に変換] ステップに進みます。
固定小数点への変換
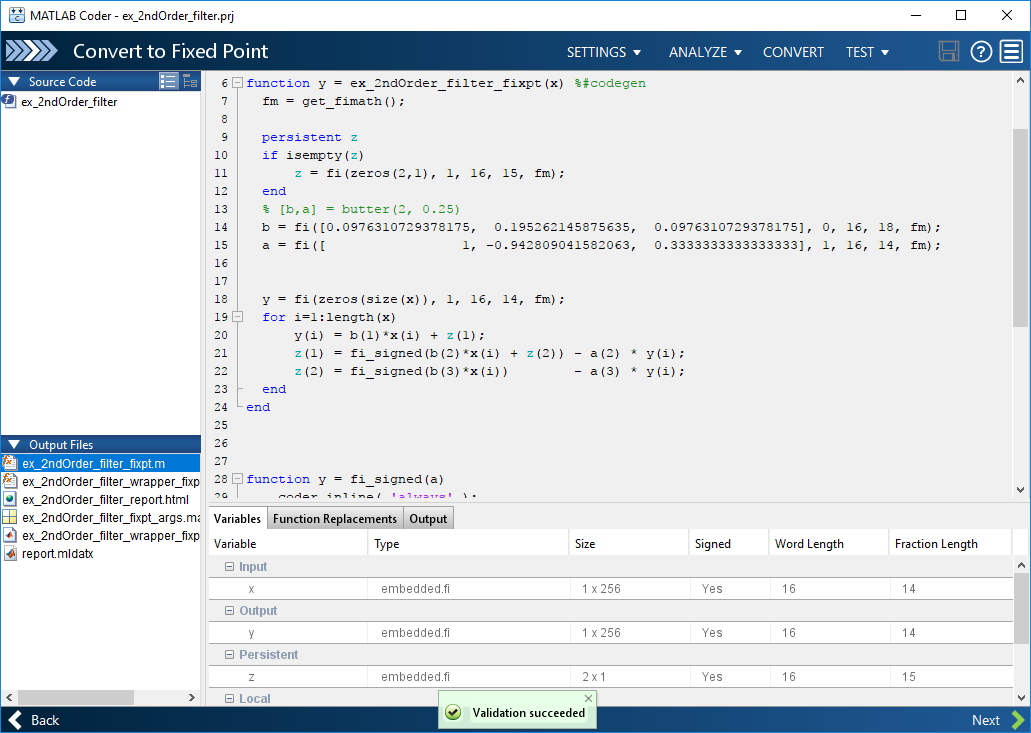
コードに含まれる変数についてコンパイルされた情報 (データ型、サイズ、実数/複素数) が表示されます。変数情報の表示と変更を参照してください。

[関数の置き換え] タブに、固定小数点の変換に対応していない関数が表示されます。シミュレーションの実行を参照してください。
[解析] 矢印
 をクリックします。[シミュレーションを使用した範囲の解析] が選択されていることと、テスト ベンチ ファイルが
 ex_2ndOrder_filter_testであることを確認します。テスト ファイルを追加して、シミュレーション中に 1 つを超えるテスト ファイルを実行することも選択できます。複数のテスト ファイルを実行する場合、シミュレーションの結果はアプリによってマージされます。[ヒストグラム データを記録] を選択します。
既定では、[コード カバレッジを表示] オプションが選択されています。このオプションを指定すると、テスト ファイルが目的の動作範囲でアルゴリズムをテストしていることを確認する際に役立つコード カバレッジ情報が表示されます。

[解析] をクリックします。
シミュレーションが実行され、MATLAB コードの左側に色分けされたコード カバレッジ バーが表示されます。この情報を確認して、テスト ファイルがアルゴリズムを適切にテストしていることを確認します。コードの左側にある濃い緑のバーは、アルゴリズムを実行するたびにコードが実行されることを示します。オレンジのバーは、横にあるコードが 1 回のみ実行されることを示します。このコードは永続変数を初期化するため、これはこの例の期待される動作です。テスト ファイルがすべてのコードをカバーしない場合は、テストを更新するかさらにテスト ファイルを追加します。

値の横に
...が付いている場合、その値は丸められています。...の上で一時停止すると、実際の値が表示されます。[変数] タブにシミュレーションの最小範囲と最大範囲が表示されます。ソフトウェアは、シミュレーション範囲のデータを使用し、既定の型推奨の設定に基づき固定小数点の型を変数ごとに推奨し、[推奨された型] 列に表示します。[変換] オプションが有効になります。
メモ
静的範囲は手動で入力できます。手動で入力した範囲はシミュレーション範囲よりも優先されます。アプリは、手動で入力した範囲を使用してデータ型を推奨します。推奨された型を変更およびロックすることもできます。
推奨された型を検証して、これらの型がシミュレーション範囲全体をカバーしていることを確認します。ある変数の記録済みのヒストグラム データを表示するには、変数の [推奨された型] フィールドをクリックします。

推奨されたデータ型を変更するには、必要な型を [推奨された型] フィールドに入力するか、ヒストグラムのコントロールを使用します。ヒストグラムの詳細は、ヒストグラムのデータの記録を参照してください。
浮動小数点アルゴリズムを固定小数点に変換するには、[変換] をクリックします。
固定小数点の変換プロセスでは、推奨された型がソフトウェアによって検証され、ローカル作業フォルダー内の
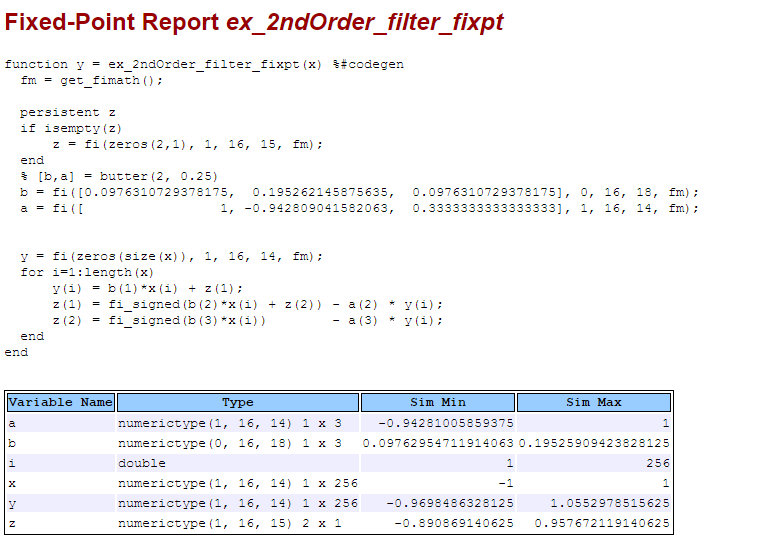
codegen\ex_2ndOrder_filter\fixptフォルダーに次のファイルが生成されます。ex_2ndOrder_filter_fixpt.m—ex_2ndOrder_filter.mの固定小数点バージョン。ex_2ndOrder_filter_wrapper_fixpt.m— このファイルは、テスト ファイルにより入力された浮動小数点データ値を、変換時に入力用に指定された固定小数点型に変換します。これらの固定小数点値は、変換後の固定小数点設計ex_2ndOrder_filter_fixpt.mに反映されます。ex_2ndOrder_filter_fixpt_report.html— このレポートは、生成された固定小数点コードと固定小数点のインストルメンテーションの結果を表示します。ex_2ndOrder_filter_report.html— このレポートは、元のアルゴリズムと固定小数点のインストルメンテーションの結果を表示します。ex_2ndOrder_filter_fixpt_args.mat— 入力引数用の構造体、出力引数用の構造体および固定小数点ファイルの名前を含む MAT ファイル。
検証中にエラーまたは警告が発生した場合、それらは [出力] タブに表示されます。型の検証を参照してください。
[出力ファイル] リストで、
ex_2ndOrder_filter_fixpt.mを選択します。生成された固定小数点コードがアプリによって表示されます。
[テスト] 矢印
 をクリックします。[比較プロット用の入力と出力を記録] を選択し、[テスト] をクリックします。
固定小数点の MATLAB コードをテストするために、入力の型の定義に使用したテスト ファイルが実行されます。オプションでテスト ファイルを追加し、数値のテスト用に 1 つを超えるテスト ファイルを実行することを選択できます。浮動小数点と固定小数点の両方のシミュレーションが実行され、出力変数
yの誤差が計算されます。比較プロット用に入力と出力のログを作成するように選択しているため、入力と出力ごとにプロットが 1 つ生成されます。アプリはこれらのプロットを 1 つの Figure ウィンドウにドッキングします。
アプリはまた、[検証の出力] タブにエラー情報も報告します。最大誤差は 0.03% 未満です。この例では、この誤差は許容可能です。
誤差が許容可能でない場合は、固定小数点データ型または元のアルゴリズムを変更します。詳細は、数値のテストを参照してください。
[検証の出力] タブに、生成された固定小数点コードおよび推奨された型情報を表示するレポートへのリンクが表示されます。

[次へ] をクリックして [コード生成] ページに移動します。
固定小数点 C コードの生成
[生成] ダイアログ ボックスで、[ビルド ソース] を
[固定小数点]に、[ビルド タイプ] を[スタティック ライブラリ]に設定します。[言語] を [C] に設定します。
[生成] をクリックし、既定のプロジェクト設定を使用してライブラリを生成します。
MATLAB Coder はプロジェクトをビルドし、C スタティック ライブラリとサポート ファイルを既定のサブフォルダー
codegen/lib/ex_2ndOrder_filterに生成します。ex_2ndOrder_filter.cに対する生成コードが表示されます。生成された C コードでは、変数には固定小数点データ型が割り当てられます。[次へ] をクリックして [ワークフローの完了] ページに進みます。
[ワークフローの完了] ページでは、プロジェクトのサマリーと生成された出力ファイルへのリンクが表示されます。