Run Polyspace Bug Finder on Desktop
Polyspace® Bug Finder™ identifies run-time errors, concurrency issues, security vulnerabilities, and other defects in C and C++ embedded software. Using static analysis, including semantic analysis, Bug Finder analyzes control flow, data flow, and interprocedural behavior. By highlighting defects as soon as they are detected, Bug Finder lets you triage and fix bugs early in the development process.
You can run Bug Finder on complete C/C++ projects from the Polyspace Platform user interface or by using scripts.
If this is your first time using Polyspace, start by using the Polyspace Platform user interface. You can create a project and set configuration options interactively in the user interface with assistance from tooltips and other diagnostic information. See Run Bug Finder in User Interface.
Once you set up a project in the Polyspace Platform user interface and complete a few trial runs, you can generate scripts from the project for automated runs. See Run Bug Finder Using Scripts.
Example Files
In this tutorial, you will run Polyspace
Bug Finder to find issues in the source files in polyspaceroot\polyspace\examples\cxx\Bug_Finder_Example\sourcespolyspacerootC:\Program Files\Polyspace\R2026a. See also Installation Folder.
Run Bug Finder in User Interface
Polyspace Platform is an integrated environment that supports static analysis and dynamic testing of C/C++ code with Polyspace products. If you set up a project in the Polyspace Platform user interface, you can use the project for running all Polyspace products. For more information, see Polyspace Platform: A Unified Platform for Static Analysis and Dynamic Testing.
Open Polyspace Platform User Interface
To open the Polyspace Platform user interface, do one of the following:
If you set up a shortcut to Polyspace on your desktop or the Start menu in Windows®, double-click the shortcut.
Otherwise, double-click the
polyspace-desktop-uiexecutable inpolyspaceroot\polyspace\binpolyspacerootC:\Program Files\Polyspace\R2026a. See Installation Folder.
Add Source Files
To run an analysis, you have to create a new Polyspace Platform project. A Polyspace Platform project points to source and include folders on your file system.
To create a project:
On the Polyspace Platform toolstrip, select New > Project.
Select a location to save your project, enter a project name,
Demo_project, and click Save.This creates an empty project file,
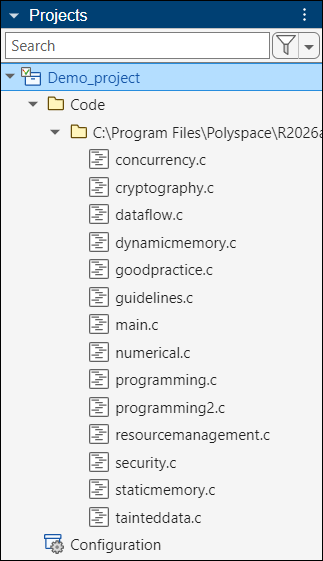
Demo_project.psprjx, and loads this project in the Projects pane of the user interface.On the Projects pane, right-click the Code node and select Add Source Folder. Add the folder
polyspaceroot\polyspace\examples\cxx\Bug_Finder_Example\sources
Your final project looks like the following:
Instead of explicitly adding sources, you can also create a Polyspace Platform project from a working build command or compilation database. On the Polyspace Platform toolstrip, select New > Project From Build Command. For more information on this workflow, see Create Polyspace Platform Project From Build Command in User Interface.
Configure Bug Finder Analysis
You can change the default options associated with a Bug Finder analysis. In this tutorial, you will change the checkers that run during static analysis with Bug Finder.
By default, Bug Finder checks for a predefined list of issues. To add the checkers for the MISRA C™: 2023 standard to this list:
On the Projects pane, double-click the Configuration node of the project.
On the Configuration pane, locate the option Use custom checkers file through search. The option is located on the Static Analysis tab in the Defects and Coding Standards section.
Select the option Use custom checkers file and then click the folder icon next to the option Checkers activation file.
In the Checkers Selection window, select MISRA C:2023 in the sidebar and select All above the list of checkers.
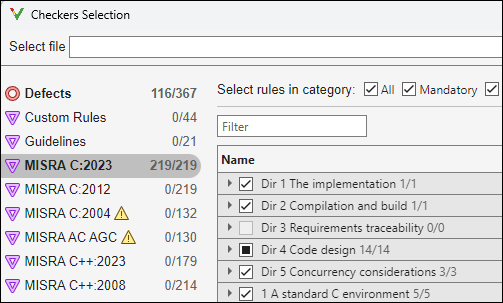
Note that the default set of Bug Finder checkers is listed on the Defects section of the Checkers Selection window.
Select Finish at the bottom of the Checkers Selection window and save the checkers file. You can see the file name entered for the option Checkers activation file.
Run Bug Finder
Once you have added sources to your project and set appropriate configuration options, you can start running Bug Finder.
To run Bug Finder:
On the Polyspace Platform toolstrip, select Find Issues. A pane opens where you can follow the progress of analysis.
Once the analysis is complete, you see the message:
On the Results pane in the lower left corner of the user interface, you see a node Demo_project Results with an Issues node below.End of Polyspace analysis
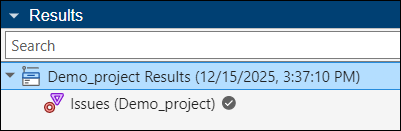
Right-click the Issues node and select Open Dashboard (or double-click the Issues node) to open a dashboard with an overview of the results.
To continue with the results review, see Review Bug Finder Results in Polyspace Platform User Interface.
Run Bug Finder Using Scripts
You can run Polyspace Bug Finder using scripts that run system commands. This tutorial shows how to generate scripts from the previously configured Polyspace Platform project so that you can run Bug Finder at the command line.
To generate a script and run Bug Finder on Windows, you can do the following steps. The steps on Linux® and Mac are similar, except for the fact that a Shell script is generated instead of batch files.
To save typing the full path to Polyspace system commands, add the path
polyspaceroot\polyspace\binPathenvironment variable on your operating system. Here,polyspacerootC:\Program Files\Polyspace\R2026a.Open a terminal and navigate to the folder where you saved the previous project
Demo_project.psprjx. Enter this command:polyspace-project -generate-launching-script-for Demo_project.psprjx -output-dir scripts -product bug-finderOnce the script generation is complete, a message suggests how to run the generated script.
Run the script using the suggestion in the previous message. For example, if the generated script is called
launchingCommand.bat, enter the following to run this script:cd scripts .\launchingCommand.batWhen the analysis is complete, Bug Finder saves the results in a file
ps_results.psbfin a folderresults. To open these results, enter the following:polyspace-desktop-ui results\ps_results.psbf
To continue with the results review, see Review Bug Finder Results in Polyspace Platform User Interface.
To run Bug Finder at the command line without going through a project, see Run Polyspace Analysis from Command Line or the reference page for the polyspace-bug-finder command.