Review Bug Finder Results in Polyspace Platform User Interface
Polyspace® Bug Finder™ checks C/C++ code for defects, coding rule violations, and security vulnerabilities. After you run an analysis, you can open and review the results in the Polyspace Platform user interface.
This topic shows how to review Bug Finder results in the Polyspace Platform user interface.
Note on terminology: In Polyspace documentation, ‘results’ refers to findings from any Polyspace product, while ‘issues’ specifically denotes findings from Polyspace Bug Finder. Since this tutorial focuses solely on Bug Finder, the terms ‘results’ and ‘issues’ are used interchangeably throughout.
Example Files
To follow the steps in this tutorial, you must have run Polyspace Bug Finder on example files using the steps in Run Polyspace Bug Finder on Desktop. Alternatively, to open a pre-analyzed project, on the toolstrip, select Help > Examples > Find defects in your C code.
If you open the results of the pre-analyzed project, the project name and the numbers shown in the screenshots below might differ from the exact numbers that you see. Nevertheless, you can follow the steps below to review the results.
Open Results
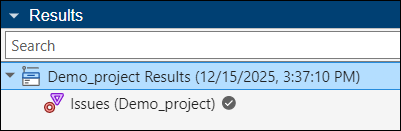
After a Bug Finder run is complete, the Results pane on the left of the user interface shows an Issues node. Double-click this node to start your results review.
The results can be seen in one of two perspectives:
The Dashboard perspective shows an overview of the results. This is the perspective that opens when you double-click the Issues node. You can also get to this perspective by right-clicking the Issues node and selecting Open Dashboard.
The Review perspective shows details of each individual result, for instance, each issue found in the code. You can get to this perspective by right-clicking the Issues node and selecting Open Review.
In each perspective, you can select the name of the other perspective on the toolstrip to switch to the other perspective. You can also click on an item in the Dashboard perspective to open a filtered view of results in the Review perspective.
For more information on opening results, see Open Polyspace Results in Polyspace Platform User Interface.
See Overview of Results
The Dashboard perspective shows an overview of the results on various cards. For instance:
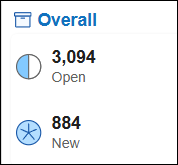
The Overall card shows how many issues are open including those from the last run and how many new issues appeared in the current run.
For instance, the card below indicates that there are 884 issues found in the new run and there are 3094 open issues combining open issues from the previous run and the new issues found.
The Defects card shows the same information for defect checkers, along with other metrics such as defect density (number of defects per 1000 lines of code).
You can select a specific type of issue on the toolstrip to see a further breakdown of results by issue type. To see a breakdown of results from defect checkers and open the subset of results in the file dataflow.c:
Select Defects on the toolstrip to open the Defects dashboard.
In the Details section of this dashboard, select View by File.
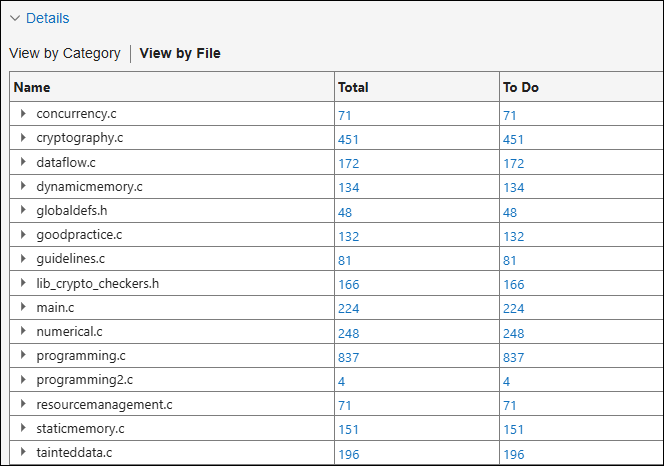
Click the hyperlinked number in the To Do column for the file
dataflow.c. This action opens the Review perspective with a list of defects found in the filedataflow.c.In the Review perspective, just below the toolstrip, you see that several filters are being applied to show a subset of results. The filters are Defects, To Do, and File: dataflow.c.

For more information on the Dashboard perspective, see Dashboard in Polyspace Platform User Interface.
View Details of Results
In the Review perspective, you see a list of issues or results on the Results List pane. You can select each result, investigate further details, then decide on a course of action, and finally implement the action. In this tutorial, you will mark a specific issue for fixing and mark another issue as not requiring an immediate fix.
Fix Code
First focus your review on high-impact defects. These are issues that have more severe consequences and that you are more likely to fix. To begin reviewing high-impact defects:
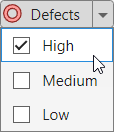
On the toolstrip, select Defects > High to show only high-impact defects on the Results List pane.
At this point, you can review each item in the list sequentially or in any other order. It is convenient to review all results of the same checker together. The next steps show how to review one result.
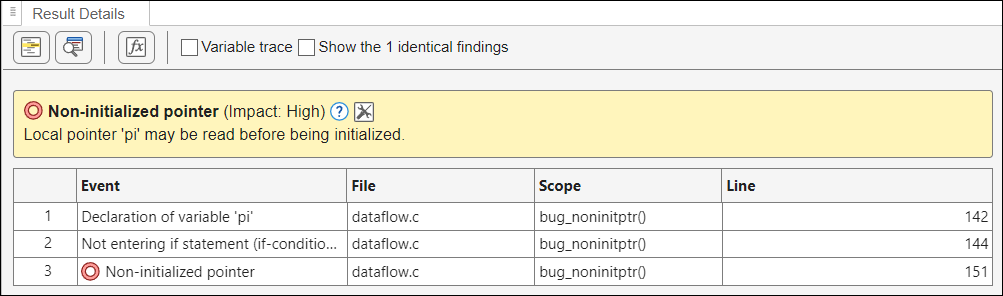
Select the Non-initialized pointer result on the Results List pane. You see the following changes:
The Result Details pane shows additional information on the issue, including variable names and a list of events that leads to the issue.
The Source Code pane shows the line in the code that has the issue. In this case, the line highlighted is the following:
*pi = j;
To understand the issue further, select each event row on the Result Details pane and navigate to the corresponding line of source code on the Source Code pane.
In this example, you can see that the pointer
piis not initialized if theif (prev == NULL)branch is skipped. This leads to an issue when the pointer is dereferenced later.Note that as you click on an item, your action gets recorded on the Navigation History pane on the left. Even if you move on to another result, you can select an item in the Navigation History pane to repeat a previous action.
Since dereferencing a non-initialized pointer is undefined behavior, you have to fix this issue. On the Result Details pane, set the Status of this result to To fix.
When you rerun analysis after fixing the source code, you can filter the results to ones with the To fix status. If there are no results after applying the filter, all the issues marked for fix have been actually fixed.
Justify Result
Next, you will look at a type of issue that you might not want to fix immediately. For instance, depending on your team or organization policy, you might leave unused code cleanup for a later phase of development. To avoid reviewing the same unused code in Bug Finder results multiple times, you can set an appropriate status to the results and filter out results with that status until you are ready to fix them. These results are considered as justified in the sense that you will not fix the issue before the next run.
Unused code is covered by several defect checkers in Bug Finder. In this tutorial, you will focus on the checkers, Dead code and Unreachable code.
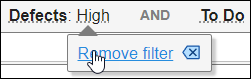
Clear the filter that shows only high-impact defects. Hover on the text High in the filter string below the toolstrip and select Remove filter.
In the Show only text box at the top of the Results List pane, enter
Dead code.This action filters the entries on the Results List to items that have the string
Dead codein any of the columns. In this case, only the Check column has this entry for the defect checker name. Therefore, the string-based search effectively acts as a filter on the Check column.Select the only Dead code result on the Results List pane. On the Result Details pane:
Set a Status of Not a defect to the result.
Add this Comment:
Scheduled for phase II cleanup
Remove the filter for
Dead codeand repeat the previous two steps, this time with the checker Unreachable code. In brief:To see only results of the Unreachable code checker, enter the string
Unreachable codein the Show only text box at the top of the Results List pane.Set the status of the Unreachable code result to Not a defect and add the comment:
Scheduled for phase II cleanup
To see all results of defect checkers in the file
dataflow.c, remove all filters except Defects and File: dataflow.c to start from a state uncluttered with review information. Depending on what you want to do next, you can apply one of these filters:To see all remaining unreviewed results, in the Filters section of the toolstrip, select To do.
To see all results you marked for immediate fix, in the Filters section of the toolstrip, select In progress.
To see both unreviewed results and ones you marked for immediate fix, in the Filters section of the toolstrip, select Open.
To see the results you previously marked for later cleanup, in the Show only text box at the top of the Results List pane, enter
phase II cleanup. You can see the Dead code and Unreachable code results that you just marked for a later cleanup.
Note that the filters To do, In progress, and Open correspond to a set of review statuses (hover on a filter to see a tooltip with the filter definition). Instead of using these filters, you can also filter by specific review statuses such as To Fix or Not a defect. Expand the Filters section of the toolstrip to see all available filters.