plotFeatures
Description
plotFeatures(
extracts the enabled features of the afe,audioIn)audioFeatureExtractor object afe from the audio input and
plots them.
plotFeatures(___,
specifies properties of the plot using one or more name-value arguments. For example, to
plot the audio signal along with the features, set Name=Value)PlotInput to
true.
figureHandle = plotFeatures(___)
Examples
Use plotFeatures to visualize audio features extracted with an audioFeatureExtractor object.
Read in an audio signal from a file.
[audioIn,fs] = audioread("Counting-16-44p1-mono-15secs.wav");Create an audioFeatureExtractor object that extracts the gammatone cepstral coefficients (GTCCs) and the delta of the GTCCs. Set the SampleRate property to the sample rate of the audio signal, and use the default values for the other properties.
afe = audioFeatureExtractor(SampleRate=fs,gtcc=true,gtccDelta=true);
Plot the features extracted from the audio signal.
plotFeatures(afe,audioIn)

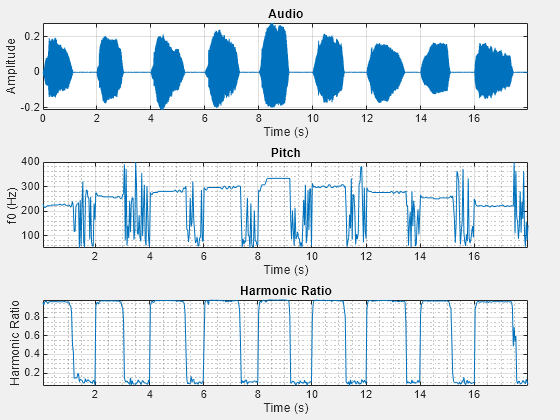
Read in an audio signal from a file.
[audioIn,fs] = audioread("SingingAMajor-16-mono-18secs.ogg");Create an audioFeatureExtractor object that extracts the pitch and harmonic ratio. Set the SampleRate property to the sample rate of the audio signal, and use the default values for the other properties.
afe = audioFeatureExtractor(SampleRate=fs,pitch=true,harmonicRatio=true);
Plot the features with PlotInput set to true to include the audio signal in the plot.
plotFeatures(afe,audioIn,PlotInput=true)
Input Arguments
Name-Value Arguments
Output Arguments
Version History
Introduced in R2022b