showSpan
Show or hide angle span between two markers
Description
showSpan( sets
angle span visibility by setting p,vis)vis to true or false.
showSpan( toggles the angle span display on and
off.p)
d = showSpan(___) returns angle
span details in a structure, d using any of the
previous syntaxes.
Examples
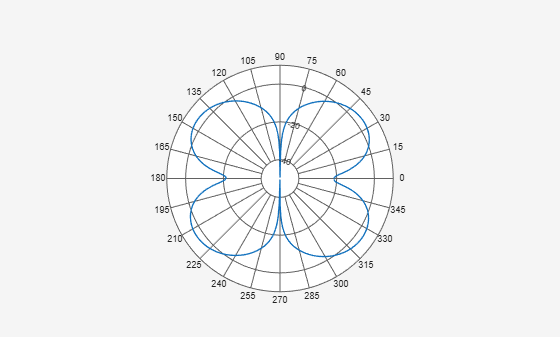
Create a dipole antenna and plot the directivity at 270 MHz.
d = dipole;
D = pattern(d,270e6,0,0:1:360);
p = polarpattern(D);
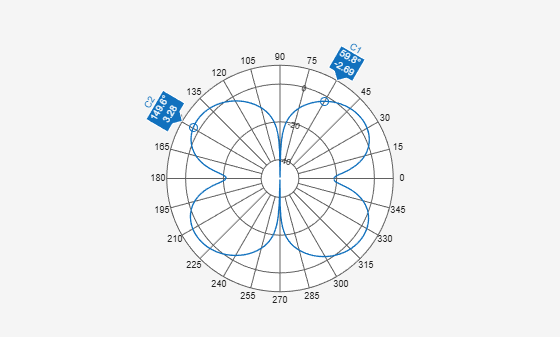
Add cursors to the polar plot at approximately 60 and 150 degrees.
addCursor(p,[60 150]);
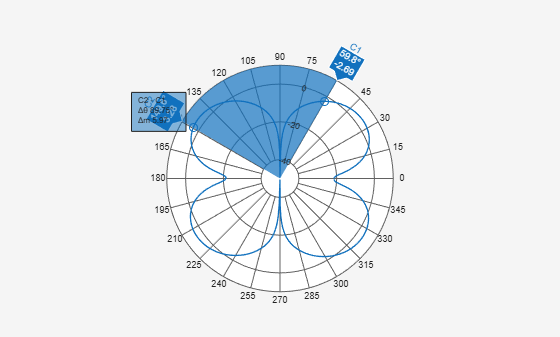
Show the angle span between the two angles.
showSpan(p,'C1','C2');
Input Arguments
Version History
Introduced in R2016a
See Also
add | addCursor | animate | createLabels | findLobes | replace | showPeaksTable