add
Add data to polar plot
Description
Examples
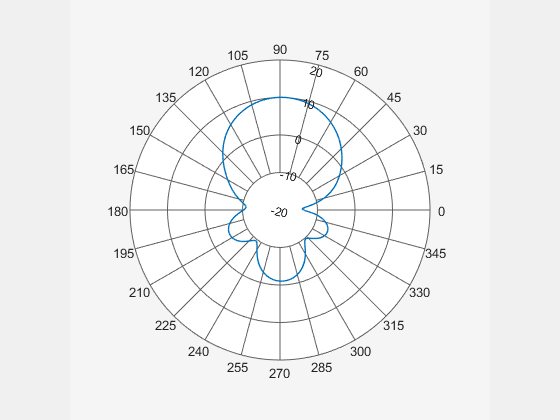
Create a helix antenna that has 28 mm radius, 1.2 mm width, and 4 turns. Calculate the directivity of the antenna at 1.8 GHz.
hx = helix(Radius=28e-3, Width=1.2e-3, Turns=4);
H = pattern(hx,1.8e9,0,0:1:360);
Plot the polar pattern.
P = polarpattern(H);
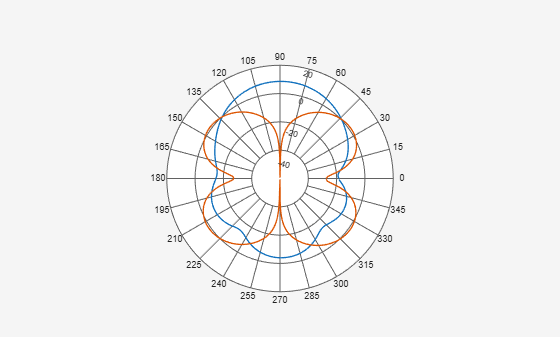
Create a dipole antenna and calculate the directivity at 270 MHz.
d = dipole;
D = pattern(d,270e6,0,0:1:360);
Add the directivity of the dipole to the existing polar plot of helix antenna.
add(P,D);
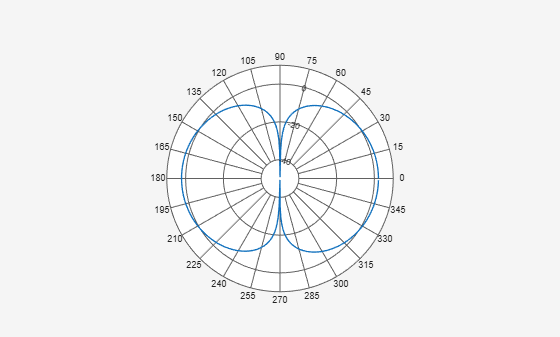
Create a dipole and plot the polar pattern of its directivity at a frequency of 75 MHz.
d = dipole;
D = pattern(d,75e6,0,0:1:360);
P = polarpattern(D);
Create a cavity antenna. Calculate the directivity of the antenna at 1 GHz. Write the directivity of the antenna to cavity.pln using the msiwrite function.
c = cavity;
msiwrite(c,1e9,"cavity.pln", Name="Cavity Antenna Specifications");
Read the data from cavity.pln to Horizontal, Vertical, and Optional structures using the msiread function.
[Horizontal,Vertical,Optional] = msiread("cavity.pln")Horizontal = struct with fields:
PhysicalQuantity: 'Gain'
Magnitude: [360×1 double]
Units: 'dBi'
Azimuth: [360×1 double]
Elevation: 0
Frequency: 1.0000e+09
Slice: 'Elevation'
Vertical = struct with fields:
    PhysicalQuantity: 'Gain'
           Magnitude: [360×1 double]
               Units: 'dBi'
             Azimuth: 0
           Elevation: [360×1 double]
           Frequency: 1.0000e+09
               Slice: 'Azimuth'
Optional = struct with fields:
         name: 'Cavity Antenna Specifications'
    frequency: 1.0000e+09
         gain: [1×1 struct]
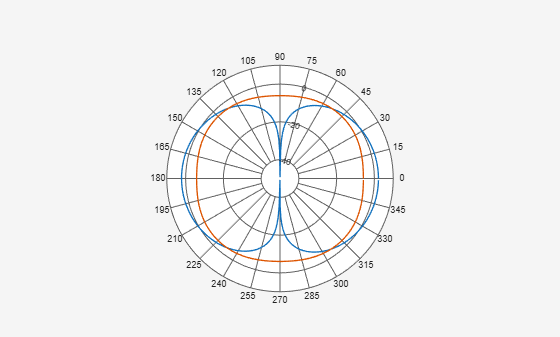
Add horizontal directivity data of the cavity antenna to the existing polar pattern of the dipole
add(P,Horizontal.Azimuth,Horizontal.Magnitude);
Input Arguments
Version History
Introduced in R2016a
See Also
addCursor | animate | createLabels | findLobes | replace | showPeaksTable | showSpan