Constrained Optimization Visualization Toolbox
Constrained Optimization Visualization Toolbox
A toolbox for visualizing the graphical approach in solving 2D constrained optimization problems.
Developed by Shahrokh Shahi |
|---|
Georgia Institute of Technology College of Computing 2018 |
Details:
This toolbox is part of the optimization visualizing series that I developed during the optimization class at Georgia Tech. More details about these toolboxes and packages is presented in this blog post.
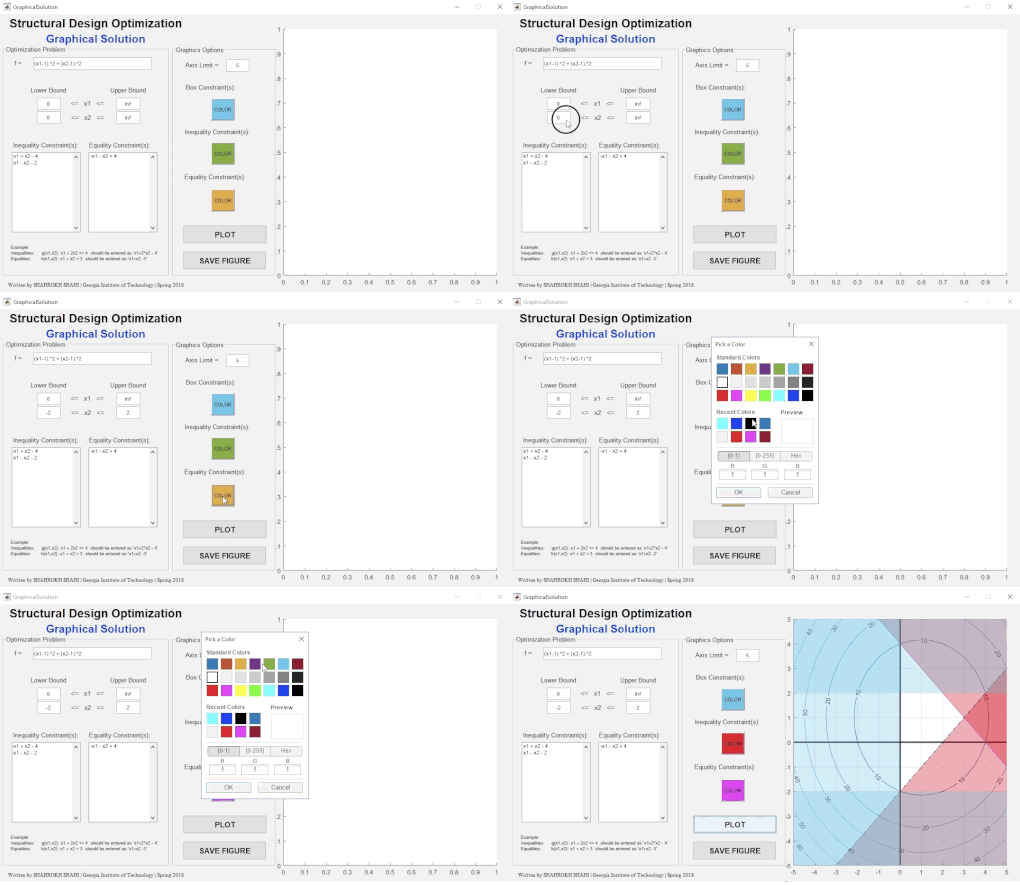
Particularly, this toolbox can be used to solve the constraint optimization problems by visualizing the constraints over an arbitrary two variable function and obtaining the optimum value(s). The constraints can be in the form of equality, inequality and box constraints, and the user can easily define the functions and choose the colors to obtain a clear vision of the problem at hand. This toolbox can serve as an effective educational demo in the optimization courses.
Sample run
Install the toolbox on MATLAB
- Run "FMinConGraphic.mltbx" in MATLAB and complete the installation
- Run fmincongraphic in MATLAB command window
- Enjoy! (The app will be run with a pre-set values as an example)
Notes
- The source codes are also available in src folder.
- Please note that the GUI is built and tested in Windows; there might be some visual differences in macOS (for instance, the test may appear smaller)
- Please feel free to contact me if there is any problem or questions.
引用
shahrokh shahi (2026). Constrained Optimization Visualization Toolbox (https://github.com/shahrokhx/Constrained_Optimization_Toolbox/releases/tag/v3.0), GitHub. 取得日: .
MATLAB リリースの互換性
プラットフォームの互換性
Windows macOS Linuxタグ
| バージョン | 公開済み | リリース ノート | |
|---|---|---|---|
| 3.0 |
|


