plotNAx
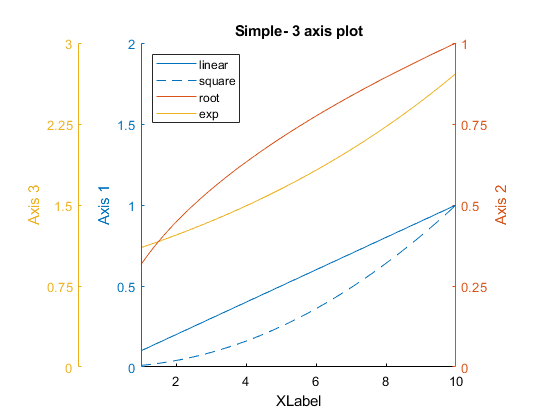
plotNAx is a plotting utility which can graph data (with formatting) across multiple y-axis with a shared x-axis.

現在この提出コンテンツをフォロー中です。
- フォローしているコンテンツ フィードに更新が表示されます。
- コミュニケーション基本設定に応じて電子メールを受け取ることができます
引用
Rohan Kadambi (2026). plotNAx (https://jp.mathworks.com/matlabcentral/fileexchange/85598-plotnax), MATLAB Central File Exchange. に取得済み.
謝辞
ヒントを得たファイル: plotyyy, addaxis, Plot with multiple Y-axes
| バージョン | 公開済み | リリース ノート | Action |
|---|---|---|---|
| 1.2.0 | Supressed output from axes set command. Updated inner y-axis to copy tick labels on construction. [2020-02-08, RPK] |
||
| 1.1.3 | % 1.1.3 - Fixed thumbnail image on mathworks file exchange
|
||
| 1.1.2 | % 1.1.2 - Fixed thumbnail image on mathworks file exchange
|
||
| 1.1.1 | % 1.1.1 - Removed internal bug tracking from published file.
|
||
| 1.1.0 | % 1.1.0 - Fixed bug in layering of axes covering the "colored" y-axis of
|
||
| 1.0.0 |

