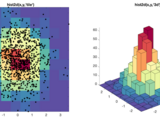
2-D histogram plot
HIST2D(X,Y) creates a bivariate histogram plot of vectors X and Y.
The function uses an automatic binning algorithm that returns bins with a uniform area, chosen to cover the range of elements in X and Y and reveal the underlying shape of the distribution. hist2d without output argument displays the bins as 3-D rectangular bars such that the height of each bar indicates the number of elements in the bin.
HIST2D(X,Y,NBINS) specifies the number of bins to use in each dimension of the histogram (default is 10).
HIST2D(X,Y,Xedges,Yedges) specifies the edges of the bins in each dimension using the vectors Xedges and Yedges.
HIST2D(...,'tile') plots the result as a tiled 2-D image.
HIST2D(...,'bar3') plots the result as a 3-D bars. This is the default graph output but without this option, it will automatically switch to 2-D if the number of total bins exceeds 2500 (e.g. 50x50).
N = HIST2D(...) returns the number of elements in a matrix N of size MxP where M is number of bins for Y direction and P the number of bins for X direction. No graph produced. Add 'bar3' or 'tile' option to force the graph.
[N,Xbins,Ybins] = hist2d(...) returns also the two bins vectors.
It is also possible to normalize the bin counts matrix:
HIST2D(...,'probability') normalizes bin counts as a probability. The height of each bar is the relative number of observations (number of observations in bin / total number of observations). The sum of the bar heights is 1.
HIST2D(...,'countdensity') normalizes bin counts as count density. The height of each bar is (number of observations in bin) / (area of bin). The volume (height * area) of each bar is the number of observations in the bin. The sum of the bar volumes is equal to numel(X) and numel(Y).
HIST2D(...,'pdf') normalizes bin counts as probability density function. The height of each bar is (number of observations in the bin) / (total number of observations * area of bin). The volume of each bar is the relative number of observations. The sum of the bar volumes is 1.
HIST2D(...,'cumcount') normalizes bin counts as cumulative counts. The height of each bar is the cumulative number of observations in each bin and all previous bins in both the X and Y dimensions. The height of the last bar is equal to numel(X) and numel(Y).
HIST2D(...,'cdf') normalizes bin counts as cumulative density function. The height of each bar is equal to the cumulative relative number of observations in each bin and all previous bins in both the X and Y dimensions. The height of the last bar is 1.
Example:
x = randn(1000,1);
y = randn(1000,1);
hist2d(x,y)
HIST2D mimics the core Matlab function HISTOGRAM2 introduced in R2015b. But the first uses release compatible language, without any dependency. It has been tested with R2011b but it should work with older releases.
引用
François Beauducel (2026). 2-D histogram plot (https://github.com/beaudu/hist2d/releases/tag/v1.4), GitHub. 取得日: .
MATLAB リリースの互換性
プラットフォームの互換性
Windows macOS Linuxカテゴリ
タグ
| バージョン | 公開済み | リリース ノート | |
|---|---|---|---|
| 1.4.0.0 | See release notes for this release on GitHub: https://github.com/beaudu/hist2d/releases/tag/v1.4 |
||
| 1.3 | See release notes for this release on GitHub: https://github.com/beaudu/hist2d/releases/tag/v1.3 |
||
| 1.2 | See release notes for this release on GitHub: https://github.com/beaudu/hist2d/releases/tag/v1.2 |
||
| 1.1.0.0 | adds bin counts normalization options: 'probability', 'countdensity', 'pdf', 'cumcount', and 'cdf'. |
||
| 1.0.0.0 |


