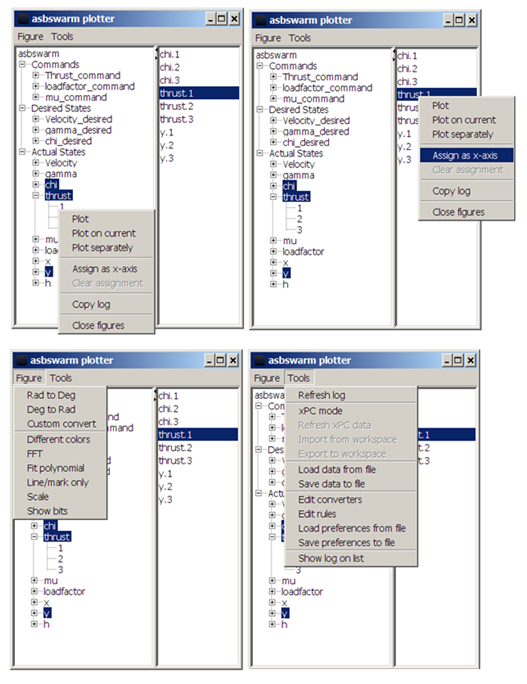
simPlotter - plot tool for Simulink log outputs

Easily plot simulation outputs!

現在この提出コンテンツをフォロー中です。

You need to enable signal logging in your model (Configuration Parameters > Data Import/Export > Signal logging) and enable logging also for signals you need. For more information on signal logging, see;
http://www.mathworks.com/help/toolbox/simulink/ug/bsxca4i-1.html#bsxca4i-3

After running the simulation you will see the output log variable in your workspace. This tool digs in that variable, finds all the signals you logged and lays out nicely on a GUI.

引用

Arda Aksu (2026). simPlotter - plot tool for Simulink log outputs (https://jp.mathworks.com/matlabcentral/fileexchange/35827-simplotter-plot-tool-for-simulink-log-outputs), MATLAB Central File Exchange. に取得済み.

一般的な情報

MATLAB リリースの互換性

  • すべてのリリースと互換性あり

プラットフォームの互換性

  • Windows
  • macOS
  • Linux
バージョン 公開済み リリース ノート Action
1.0.0.0