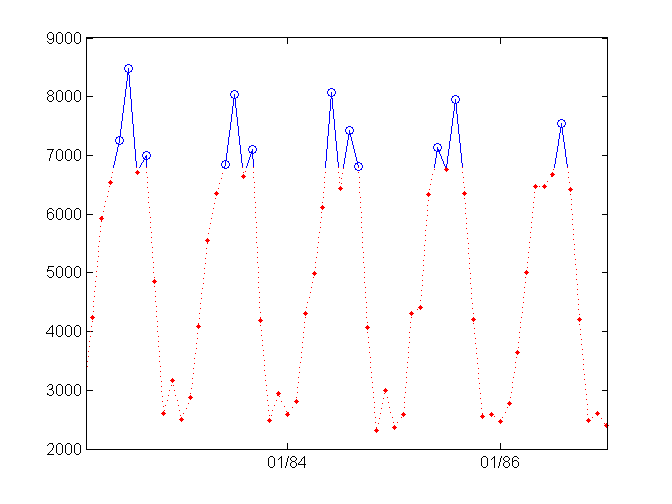
Conditionally colored line plot
Plots (2D line) graph split into two colors above and below a given threshold value

現在この提出コンテンツをフォロー中です。
- フォローしているコンテンツ フィードに更新が表示されます。
- コミュニケーション基本設定に応じて電子メールを受け取ることができます
引用
Matt Tearle (2026). Conditionally colored line plot (https://jp.mathworks.com/matlabcentral/fileexchange/30423-conditionally-colored-line-plot), MATLAB Central File Exchange. に取得済み.
謝辞
ヒントを与えたファイル: Conditionally Colored Plot (CCPLOT)
| バージョン | 公開済み | リリース ノート | Action |
|---|---|---|---|
| 1.1.0 | Made a quick hack to the input-parsing utility to deal with the change in precedence rules. It should now work in 19b and in previous versions. Hasn't been really thoroughly tested, though, so please report any problems. |
||
| 1.0.0 | Updated license |
||
| 1.0.0-0 |

