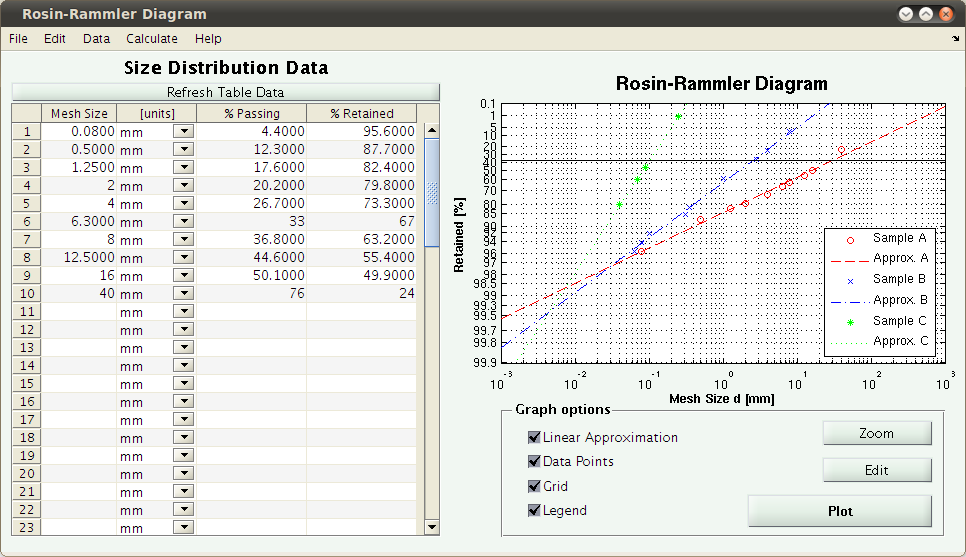
Rosin-Rammler Diagram plotting tool
This tool plots the Rosin-Rammler Diagram (RRSB) and calculates various related parameters.

現在この提出コンテンツをフォロー中です。
- フォローしているコンテンツ フィードに更新が表示されます。
- コミュニケーション基本設定に応じて電子メールを受け取ることができます
引用
Ivan Brezani (2026). Rosin-Rammler Diagram plotting tool (https://jp.mathworks.com/matlabcentral/fileexchange/28013-rosin-rammler-diagram-plotting-tool), MATLAB Central File Exchange. に取得済み.
| バージョン | 公開済み | リリース ノート | Action |
|---|---|---|---|
| 1.16.0 | Code simplified. Now using only natural logarithm. Y-TickMarks calculated from Y-Ticks.
|
||
| 1.15.0 | Acknowledgement added. |
||
| 1.14.0 | Description update |
||
| 1.13.0 | In description following link is added: http://actamont.tuke.sk/pdf/2010/n2/7brezani.pdf Onlineavailable article about algorithms used and basic info about RR Diagram (no instructions for using this tool). |
||
| 1.12.0 | Updated to version 1.0 (final)
|
||
| 1.11.0 | Added option to show % Passing on Y-axis |
||
| 1.9.0 | Added copyright and license notes to functions and published html file. |
||
| 1.5.0 | Updated to version 0.9 - added support for RR distribution parameters determination by equation fitting (optionally)
|
||
| 1.4.0 | Minor changes to html file |
||
| 1.0.0 |

