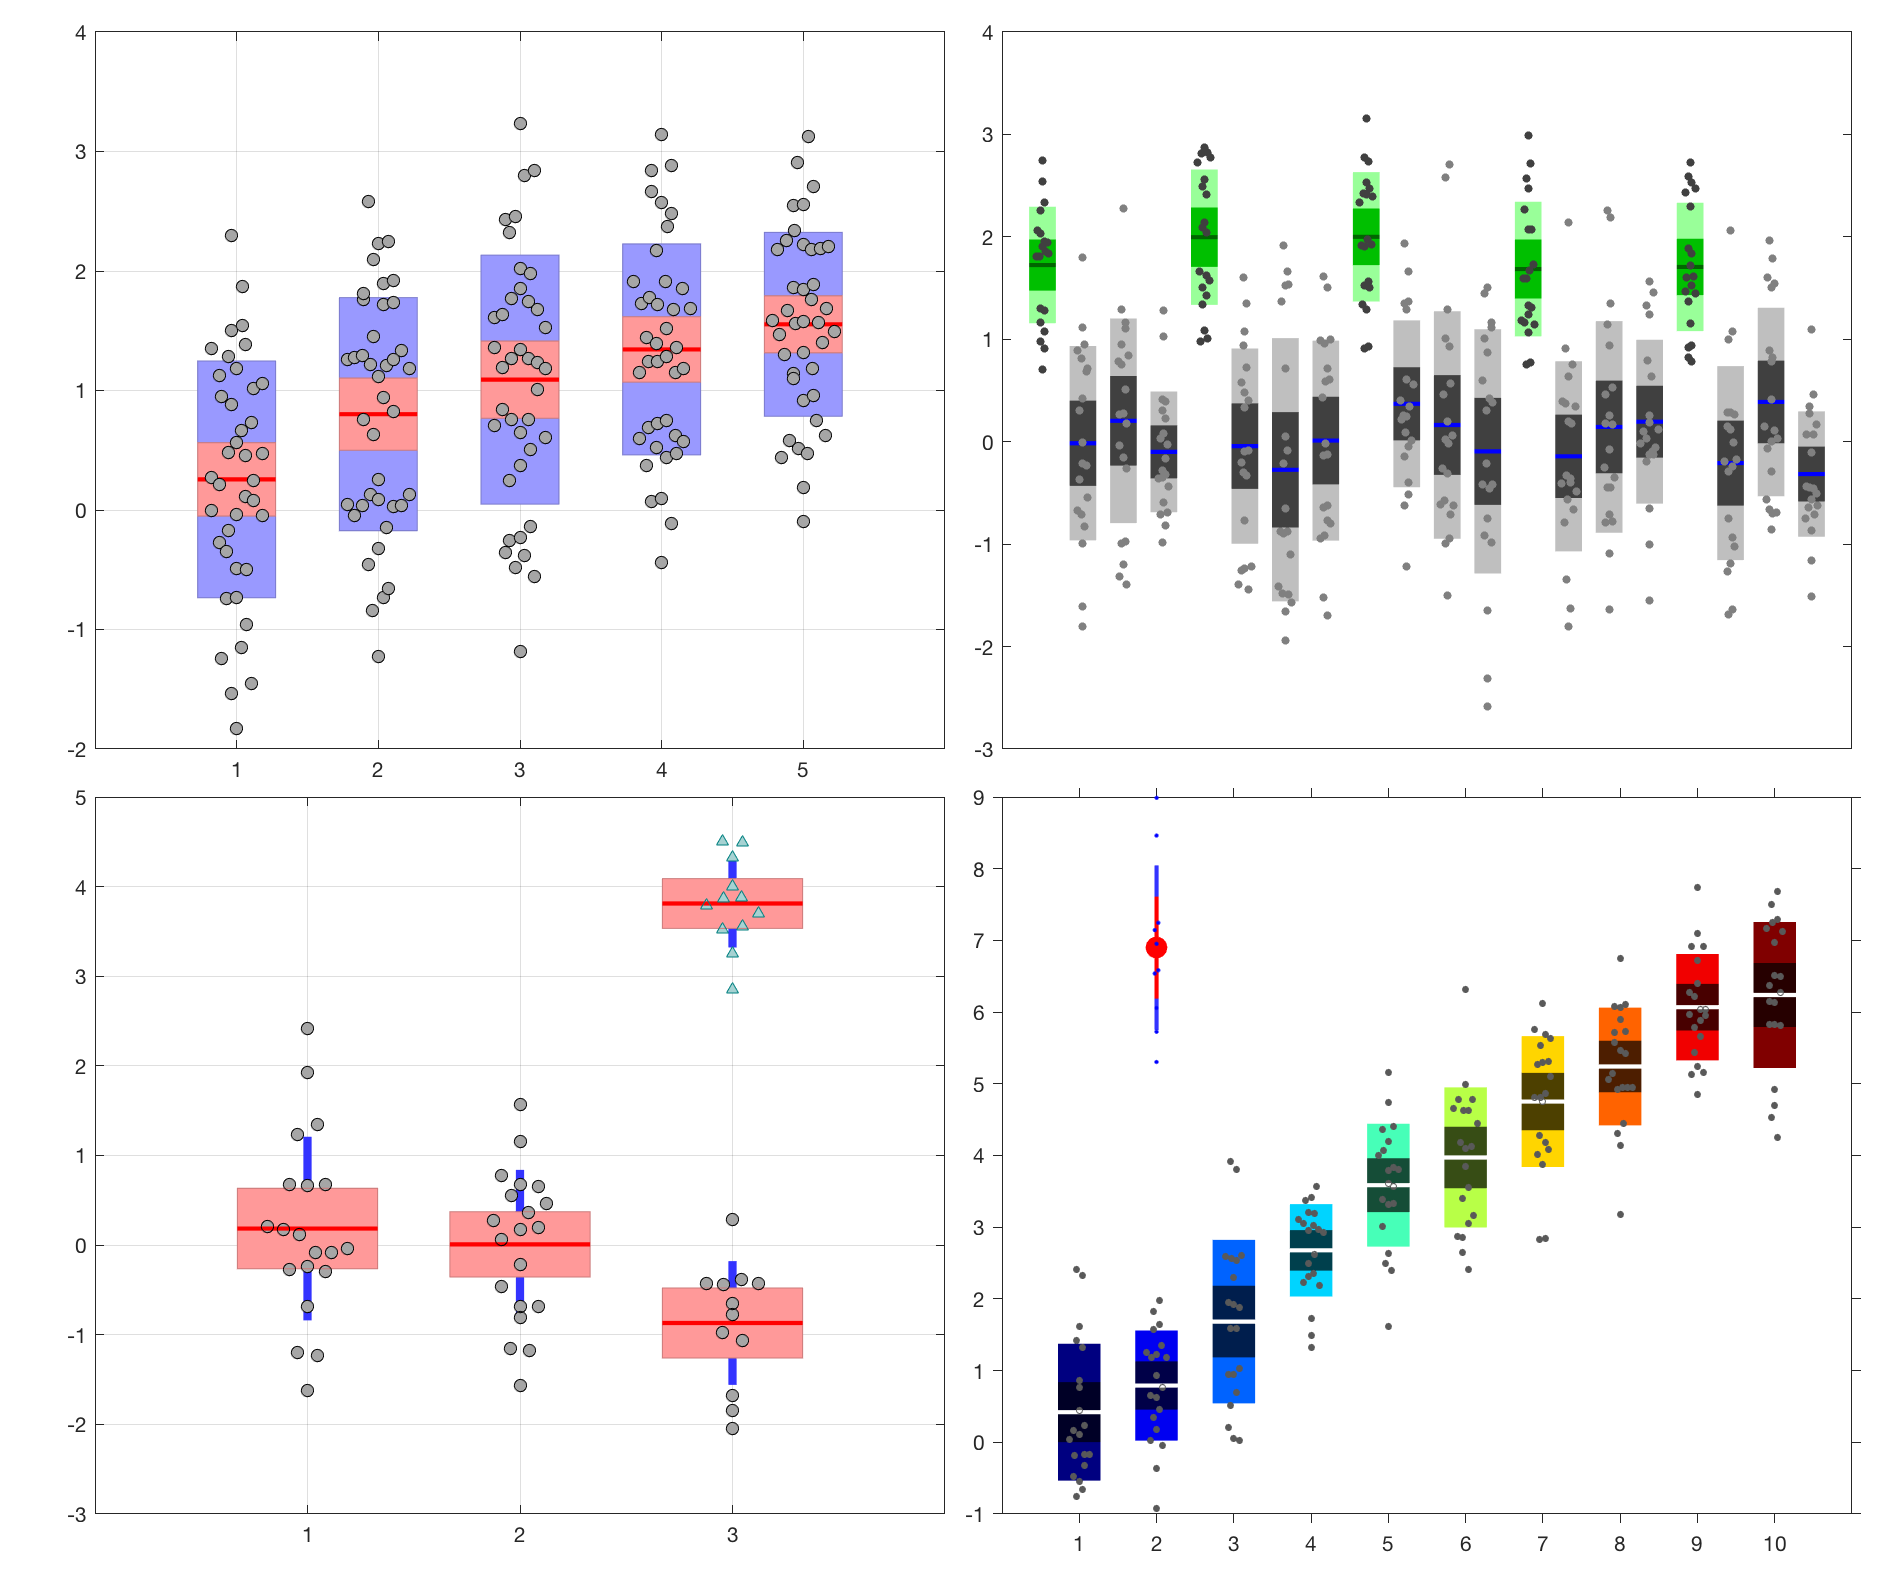
notBoxPlot
This function visualizes raw (grouped) data along with the mean, 95% confidence interval, and 1 SD.

現在この提出コンテンツをフォロー中です。
- フォローしているコンテンツ フィードに更新が表示されます。
- コミュニケーション基本設定に応じて電子メールを受け取ることができます
編集メモ: This file was selected as MATLAB Central Pick of the Week
引用
Rob Campbell (2026). notBoxPlot (https://github.com/raacampbell/notBoxPlot), GitHub. に取得済み.
謝辞
ヒントを与えたファイル: jqu224/masterProject, plotfdesign(T,G,varargin), Alternative box plot, UnivarScatter
一般的な情報
- バージョン (16.3 KB)
-
 GitHub でライセンスを表示
MATLAB リリースの互換性
- すべてのリリースと互換性あり
プラットフォームの互換性
- Windows
- macOS
- Linux
| バージョン | 公開済み | リリース ノート | Action |
|---|---|---|---|
| 1.31.0 | BUGFIX to SEM and t-interval calc. Jittered points have a neater form, more like those seen in violin plots. |
||
| 1.15.0 | Verified to work with R2015a |
||
| 1.14.0 | Update summary. |
||
| 1.13.0 | Fixed bug that didn't pass input arguments correctly when two vectors are supplied. |
||
| 1.11.0 | Update summary to explain that the function works without the stats toolbox if the nan-toolbox is installed. |
||
| 1.10.0 | Better handles x-ticks and x axis limits. Add missing semicolon. |
||
| 1.9.0 | Fix bug that was causing handles not return for one of the plot formats. |
||
| 1.8.0 | Both x and y can now be vectors, in which case the function behaves like Mathworks' boxplot. An example of this behaviour is provided. An example of the "sdline" plot style is now provided. |
||
| 1.7.0 | If "y" is a vector then the function ensures it is a column vector in order to yield one box-plot. |
||
| 1.6.0 | The 4th argument can now also have the value "sdline". This creates plots where the SD is a line instead of a patch. |
||
| 1.5.0 | Handle to mean line when in patch mode (the default mode) is now returned. |
||
| 1.4.0 | Add link to JCB article on error bars. |
||
| 1.3.0 | Add tInterval_Calc and update the comments in SEM_calc |
||
| 1.1.0 | re-upload because support file (SEM_calc.m) seemed to be missing |
||
| 1.0.0 |

