現在この提出コンテンツをフォロー中です。
- フォローしているコンテンツ フィードに更新が表示されます。
- コミュニケーション基本設定に応じて電子メールを受け取ることができます
Nyquist Visualiser
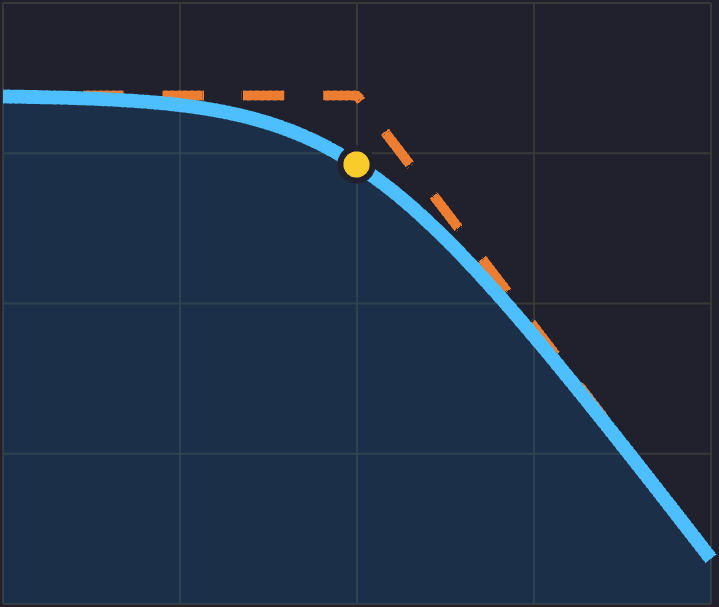
This app plots the Nyquist diagram alongside Bode magnitude and phase plots for a given transfer function.
Features:
- Frequency slider with play/pause
- Pole/zero editor — add or remove real or complex-conjugate roots; plot updates automatically
- Datatip labels for poles/zeroes
Usage:
Run
>> NyquistVisualiser
Input formats accepted:
(s+1)/(s^2+2*s+1)
(s+1)/(s^2+2*s+1) * exp(-0.01*s)
[1 1] / [1 2 1]
tf([1 1],[1 2 1])
Requirements:
MATLAB R2019b+, Control System Toolbox
引用
Jayan (2026). NyquistVisualiser (https://jp.mathworks.com/matlabcentral/fileexchange/183870-nyquistvisualiser), MATLAB Central File Exchange. に取得済み.
謝辞
ヒントを得たファイル: BodeVisualiser
| バージョン | 公開済み | リリース ノート | Action |
|---|---|---|---|
| 1.0.0 |
