
現在この提出コンテンツをフォロー中です。
- フォローしているコンテンツ フィードに更新が表示されます。
- コミュニケーション基本設定に応じて電子メールを受け取ることができます
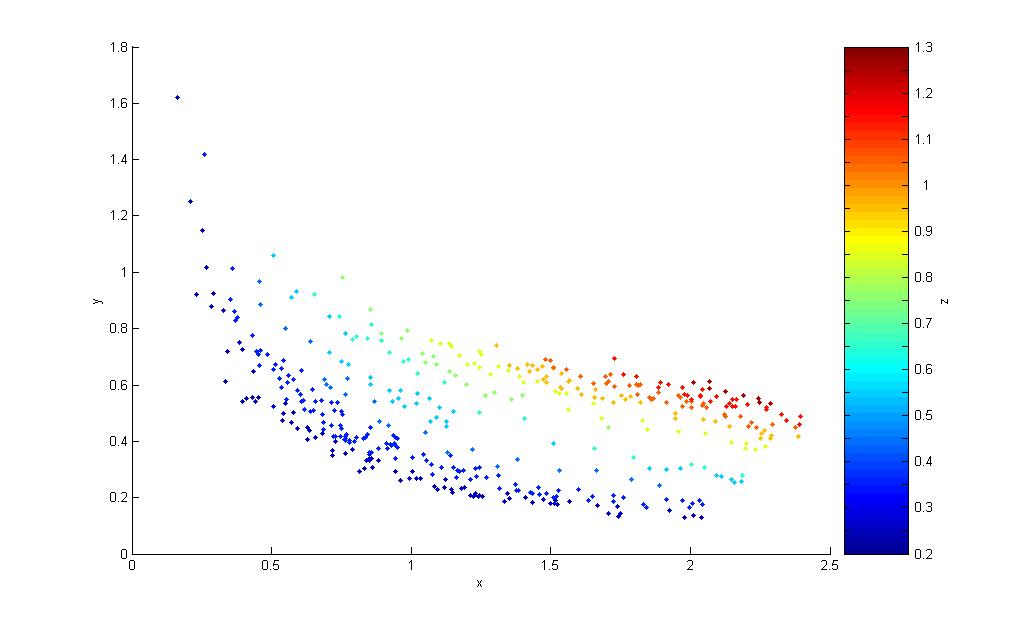
Allows 3d scattered data to be plotted as a 2d scatterplot (i.e. plot(,,'.') ) with the third dimension being displayed as colour. Each point is coloured depending on the value of z, which is binned (bins edges or number of bins can be specified).
引用
Jonathan Tinker (2026). plot3c (https://jp.mathworks.com/matlabcentral/fileexchange/14256-plot3c), MATLAB Central File Exchange. に取得済み.
一般的な情報
- バージョン 1.0.0.0 (1.28 KB)
-
ライセンスがありません
MATLAB リリースの互換性
- すべてのリリースと互換性あり
プラットフォームの互換性
- Windows
- macOS
- Linux
| バージョン | 公開済み | リリース ノート | Action |
|---|---|---|---|
| 1.0.0.0 |
