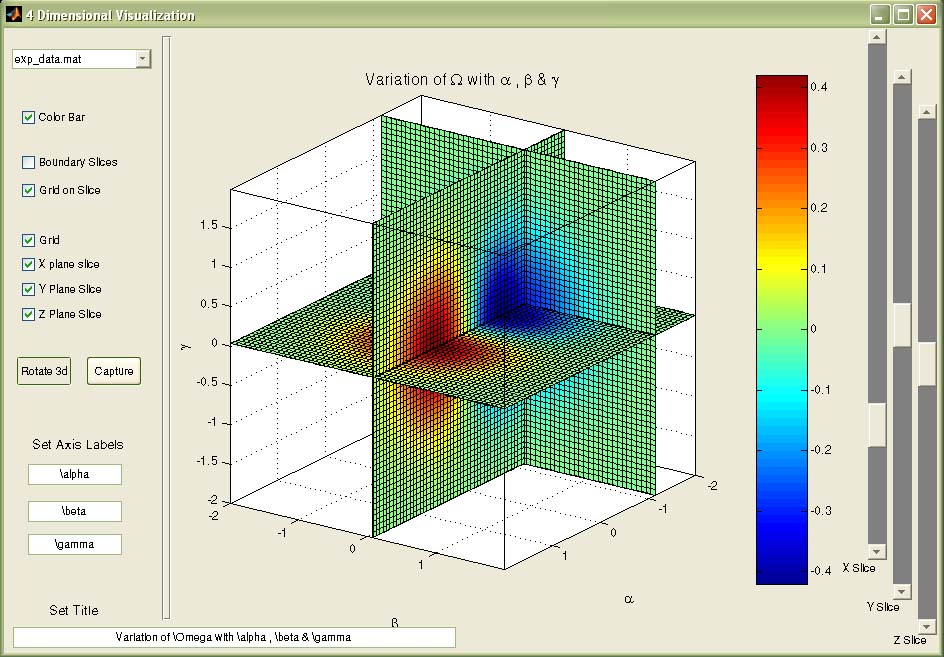
4 Dimensional visualization

This is to visualize the functions of 3 variables: z=f(x,y,t), which becomes 4 dimensional problem

現在この提出コンテンツをフォロー中です。

This is to visualize the functions of 3 independent variables ( v=f(x,y,z) ), which becomes 4 dimensional problem.

It just uses the MATLAB function "slice", in an effective way, leading to customizable 4 dimensional visualization tool.

Function should first be calculated at the required 3-dimensional grid and stored as ?.mat? file in the folder "\Visual_Data\".

The ".mat" files should contain the following variables,

X
Y
Z
V

X, Y, Z are the 3 coordinate points and V is the function. All the variables will be 0f l x m x n in size ( three dimensional array with same dimensions)

One example data file is included in the folder.

Many such mat files can be created and kept in the same folder, which can be selected for visualization from the pop-up menu.

A simple m file (2-lines) Create_Volume.m is also included, which may be useful for generating data for simple functions.

Authors Comment:
-- Was written in a hurry for the author?s own requirement and later refined.
-- Will be useful as a quick tool for many scientific investigations for understanding the structure of any 4-dimensional functions.

引用

J. Divahar (2026). 4 Dimensional visualization (https://jp.mathworks.com/matlabcentral/fileexchange/13503-4-dimensional-visualization), MATLAB Central File Exchange. に取得済み.

カテゴリ

Help Center および MATLAB AnswersCreating and Concatenating Matrices についてさらに検索

一般的な情報

MATLAB リリースの互換性

  • すべてのリリースと互換性あり

プラットフォームの互換性

  • Windows
  • macOS
  • Linux
バージョン 公開済み リリース ノート Action
1.1.0.0

Updated to make it work in non WINDOWS Operating Systems also by changing the path specification using "/"

1.0.0.0

"Error with Slider value" problem was rectified. Thanks to Ms.Srividya for her feedback about it.