結果:
- Why do the stations transmit to each other while there is no association among them?
- How the stations transmit to the access point while the traffic generation is one way?
please find the attached code"ex1_AP_STA.m" and output data of simulator "Simulation data.zip"
when i use command openExample('px4/PX4HITLSimulationFixedWingPlantSimulinkExample'),matlab shows "PX4HITLSimulationFixedWingPlantSimulinkExample" cannot find. So does somebody know how to find this demo? Thanks.
ncorr is not working on MATLAB 2023b new version, it gives me an error. Does somebody know why? Thanks
Dear all,
In an excel file, we have temperature (te) and humidity (hu) data in two columns. The Gaussian kernel-density estimation and best-fit quadratic curve were plotted. However, we need to determine whether the relationship is statistically significant or not, as well as the coefficient of determination (R2). For calulation of the both of them, we used functions like:
2. statistically significant p= coefTest(aa)
Is it correct? If not, please provide the any other suggestions.
Thank you.
For example, my main line chart have values: X=[10 20 30 40 50] Y=[0.5 1.5 5 -6 4]. I need to add second X axis, with value [1 2 3 4 5] but but I would like the distance between individual points to be variable. For example, between points 1-2 d=25, between 2-3 d=10. I would like to define this distance freely.
xt = e^-3t
ht= -5e^-2t +6e^-3t
so ofcourse these would be used to plot yt which is xt*ht in other words xt conv ht. Thanks for your assistance!!
Recently, I came across a post about the JIT compiler on this Korean blog. In the post. The writer discussed the concept of the "Compile Threshold" and how it is calculated.
"The JVM accumulates the number of calls for each method called and compiles when the number exceeds a certain number. In other words, there is a standard for checking how often it is called and then deciding, 'It is time to compile.' This standard is called the compilation threshold. But what is this and why should it be used as a standard?"
The concept of the "Compile Threshold," as used above, seems to be more commonly associated with Tracing just-in-time compilation.
The writer used the simple Java code below to calculate the threshold.
for (int i = 0; i < 500; ++i) {
long startTime = System.nanoTime();
for (int j = 0; j < 1000; ++j) {
new Object();
}
long endTime = System.nanoTime();
System.out.printf("%d\t%d\n", i, endTime - startTime);
}
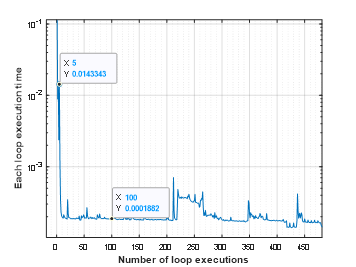
Since the MATLAB execution engine uses JIT compilation, I just wanted to perform the same experiment that the writer did.
I experimented using simple codes based on the code in the blog. I iterated a function 500 time using for-loop and calculated the execution time for each iteration using tic and toc. Then I plotted the execution time for each loop as blow. First five execution times are much higher than followings (10 times!) The test is very rough so I am not sure that I can conclude "MATLAB has Compile Threshold and it is 5!" but this value is actually correct ;-)
t0 = 0;
tfinal = 10;
y0 = [20;20];
timeToRun = zeros(500,1);
for i = 1:500
tStart = tic;
[preypeaks,predatorpeaks] = solvelotka(t0, tfinal, y0);
tEnd = toc(tStart);
timeToRun(i) = tEnd;
end
VS Code Extension for MATLAB was introduced back in April and has been downloaded 75K times since. Do people here use VS Code for writing MATLAB code?


Wait for Walter, the rest of us are mere users.

MATLAB Training

MATLAB Training

Mathworks tech support

Stand Back. I'm going to try MATLAB.

Embarassed by Walter Roberson

I use MATLAB.

MATLAB Reloaded

MATLAB Men

MATLAB rule!

So true.