結果:
Hi, I'm in truble because I have two programs with the same variables and parameters. The main of the study is to change a value and plot the results. The problem is that I want them on the same plot but I use the same name for the variabes in the two different programs so when I use some function to join the figures togheter matlab resets the values obtained in the first program and runs only the second one.
Is there a method to avoid changing all the names of the variables in one of the two programs (because they have something like 500 lines)?
I saw this post on Answers.
I was impressed at the capability of the AI, as I have been at other times when I posed a question to it, at least some of the time. So much so that I wondered...
What if the AI were automatically applied to EVERY question on Answers? Would that be a good or bad thing? For example, suppose the AI automatically offers an answer to every question as soon as it gets posted? Of course, users would still be allowed to post their own, possibly better answers. But would it tend to disincentivise individuals from ansering questions?
Perhaps as bad, would it push Answers into the mode of a homework solving forum? Since if every homework question gets a possibly pretty good automatic AI generated solution, then every student will just post all HW questions, and the forum would quickly become overwhelmed.
I suppose one idea could be to set up the AI to post an answer to all un-answered questions that are at least one month old. Then students would not gain by posting their homework.
Hi everyone,
I would like to ask you if it would be possible to do an HiL simulation using an environment model simulated via Simulink and load in a target computer connected to the hardware needed. The target computer will be simply a laptop with Matlab&Simulink package installed and directly connected to the bench to test.
I have found some solutions about the use of Simulink Real-Time but it implies the use of a Speedgoat unit, so I was wondering if anyone has ever done it without that device.
Thank you very much.
Hi, I'm trying to analyze a .vtk data set from MRI. I already calculate the kinetic energy. Now I'm trying to calculate the viscous energy loss but the result that I found does not respect the reality so I think that I'm doing something wrong.
Can someone help me with this?
%% FUNCTION
function energy_loss = calculateViscousEnergyLossForAllPhases(MRI_Velocity, dynamic_viscosity,interval)
% Preallocate the energy_dissipation array
energy_loss = zeros(1, 30);
for idx_phase = 1:30
% Velocity field
vel_x = MRI_Velocity{1, idx_phase}.velocity(:,1) * 1e-2; % Velocity in X from cm/s to m/s
vel_y = MRI_Velocity{1, idx_phase}.velocity(:,2) * 1e-2; % Velocity in Y in m/s
vel_z = MRI_Velocity{1, idx_phase}.velocity(:,3) * 1e-2; % Velocity in Z in m/s
% Coordinates
x = MRI_Velocity{1, idx_phase}.points(:,1) * 1e-3; % from mm to m
y = MRI_Velocity{1, idx_phase}.points(:,2) * 1e-3;
z = MRI_Velocity{1, idx_phase}.points(:,3) * 1e-3;
% Compute partial derivatives
dUdx = gradient(vel_x, x, 1);
dUdy = gradient(vel_x, y, 2);
dUdz = gradient(vel_x, z, 3);
dVdx = gradient(vel_y, x, 1);
dVdy = gradient(vel_y, y, 2);
dVdz = gradient(vel_y, z, 3);
dWdx = gradient(vel_z, x, 1);
dWdy = gradient(vel_z, y, 2);
dWdz = gradient(vel_z, z, 3);
% Calculate energy dissipation
ED = 2 * (dUdx.^2 + dUdy.^2 + dUdz.^2) + ...
2 * (dVdx.^2 + dVdy.^2 + dVdz.^2) + ...
2 * (dWdx.^2 + dWdy.^2 + dWdz.^2) + ...
(dUdz + dWdx).^2 + (dVdx + dUdy).^2 + (dWdy + dVdz).^2;
% Scale by dynamic viscosity of fluid and store
energy_loss(idx_phase) = sum(ED, 'all', 'omitnan') * dynamic_viscosity * interval.^3;
end
end
%% CODE
dynamic_viscosity_blood = 0.0039;
% human dynamic_viscosity_blood from 0.003 to 0.004; % Approximate value for blood at body temperature
% Call the function to calculate viscous energy loss for blood flow for all phases
energy_loss_RV_J = calculateViscousEnergyLossForAllPhases(MRI_Velocity_RV, dynamic_viscosity_blood,interval/1000);
energy_loss_LV_J = calculateViscousEnergyLossForAllPhases(MRI_Velocity_LV, dynamic_viscosity_blood,interval/1000);
% From Joule to milliwatt (mW)
energy_loss_RV_mW = energy_loss_RV_J.*1e3;
energy_loss_LV_mW = energy_loss_LV_J.*1e3;
figure
plot(time, energy_loss_RV_mW, 'r','LineWidth',1.5);
hold on
plot(time, energy_loss_LV_mW,'b','LineWidth',1.5);
title('Viscous energy loss over Cycle','FontSize',14);
xlabel('Cycle','FontSize',12);
ylabel('Viscous energy loss [mW]','FontSize',12);
legend('RV','LV')
Hi Friends,
I'm looking for a matlab program which calculat deflection of simply supported tapered beam under uniform travers load.
Thank you for your help.
Hello, how can i write a combination of matrcies as follows L=[ai_j] of order 4,M of order 4, then S=[4*ai_j+M] of order 4. i mean each element in S is a matrex of order 4
Hello,
I have an equation model following a law of type power: s=aN^b
For the measure equation, I have also a power law: m=cN^d
So I would like to have an extended Kalman Filter code in Matlab for this case. CAN YOU HELP ME PLEASE ?
hi there, my name is ayush. Im a bachelor student from india. I was doing a semester project in topology optimization. can you tell me how you run the file (https://www.topopt.mek.dtu.dk/apps-and-software/new-99-line-topology-optimization-code-written-in-matlab)in matlab. In one of your answers you provided the source, from there i got the matlab file. i was thinking of doing a project on it, but i cant run the file. its showing error.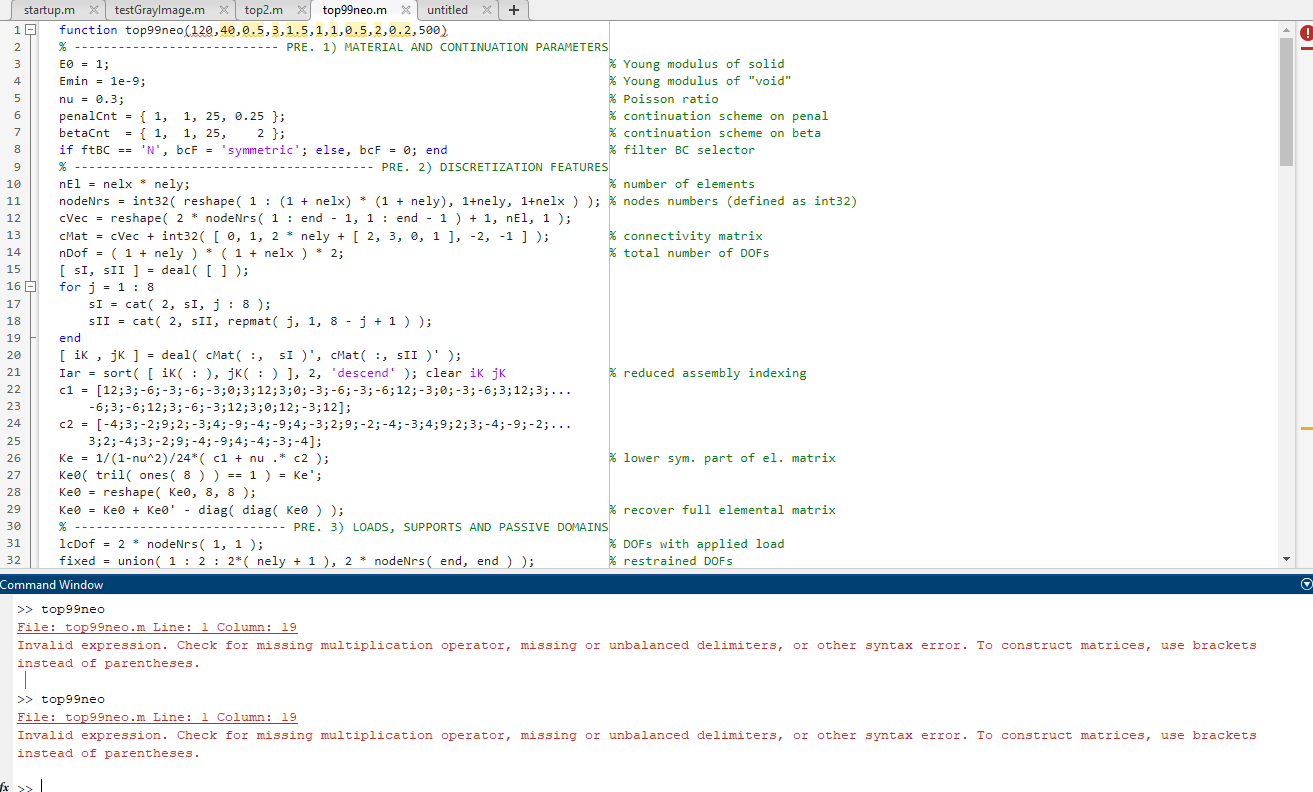
i provided the value of ftBC = 1. I have no priorknowledge of matlab. i want to learn it though.
Hello.
I use readgeoraster to read in a 25MB geotiff. I then turn around and immediately write out the data with geotiffwrite. The resultant file is now 250MB.
What is the explanation for this 10x increase in file size? The data read in are 'single' format. And that is the exact data I am writing out.
Dave
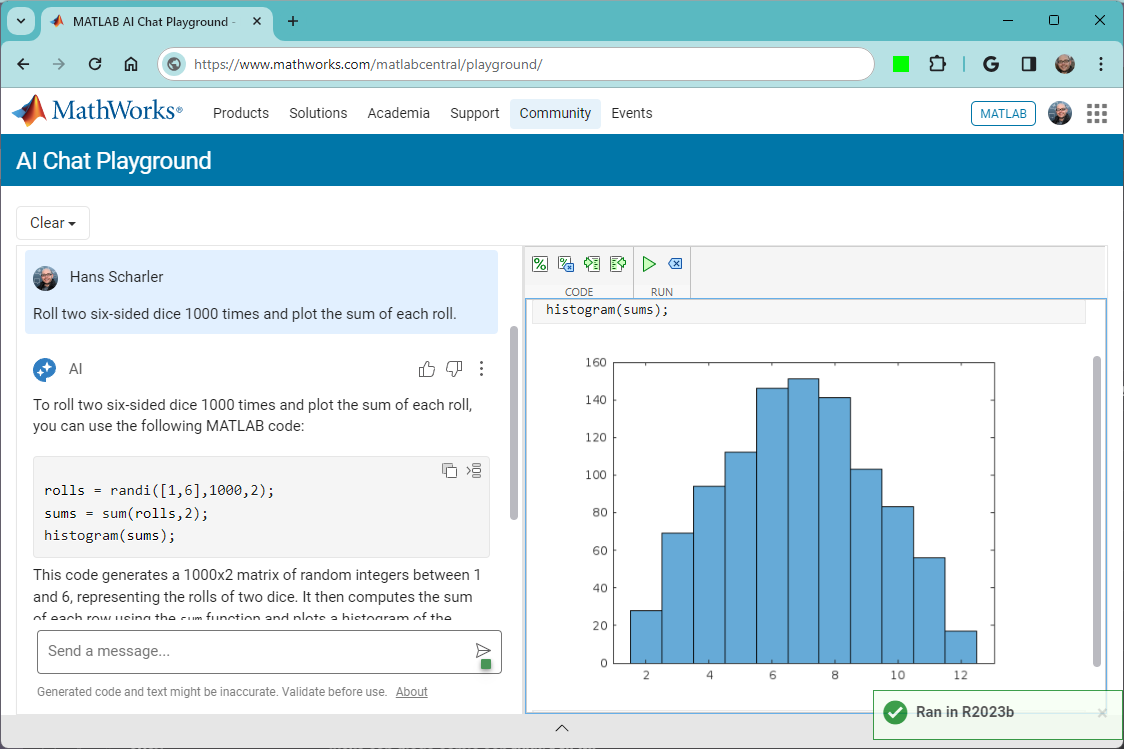
The MATLAB AI Chat Playground is open to everyone!
Check it out here on the community: https://www.mathworks.com/matlabcentral/playground
i need to create an app in app designer that is able to convert ac to dc. i already created the layout of the app and i created a curcuit that is able to convert ac to dc in sumilink. but i am having troubles linking the circuit simulation to the app.
Basically, i want the user to input the voltage in the app and it should send that data to the simulation and the output should come back to the app.
I want to use "phased" fuction to generate pedestrain dataset, but I don't know how to generate multi-path.
Hi
I connected raspberry pi with MATLAB. But when I deployed the function, I kept reminding me that the function was not found. But my function does exist and can be implemented
Can you tell me why and how to solve it?
Many thanks,
Bang
When I apply genetic algorithm to find the optimal parameter, before the parameter enters the algorithm, I have controlled the parameter to keep two decimals in their respective ranges, but when the final output, the optimal parameter returned is really six decimals. Why? What am I supposed to do? (Note: I need to keep two decimal places in the parameter before entering the algorithm, because a change of 0.001 in the parameter has a great effect on the result, so I can't round the result directly.)Look forward to your reply~
good afternoon everyone my name is Dundu lawan haruna ,i'm a final year student at the department of computer engineering ABU Zaria, Nigerian , and i wanted to do my final year project based on computer vision : project topic , designing an eye glasses to help those people with visual imparement to be able to navigate enviroment efficiently , that's why i need a support from you guys ,all advised are highly well come , thank you for your support.
Hi, Im new to here. I wanted to ask for assitance in plotting ellipsoids onto XYZ plots based on Excel data. The data shows details for seismic events but the analysis needs to be just looking into the data as points on a XYZ graph. I have no experience with Matlab and any help would be greatly appreciated.
The first column is to identify the point; Column B is the time of the event; Column C-E is the location of the point. Column D reflects the amount of energy released. Colums G-R are for eigenvalues and eigenvectors.
Each ellipsoid is described by the 3 semi-major axes, named 1, 2, 3 in our file.
The 3 columns Axis 1, Axis 2, Axis 3 are the length (eigenvalues) of the 3 semi-major axis in metres.
The next 9 columns define the semi-major axis vectors (eigenvectors), so for example [Vector 1 X, Vector 1 Y, Vector 1 Z] define the 3 direction cosines (XYZ) of the Axis 1 vector.
So for example:
Axis 1 of the ellipsoid for Trigger ID 1 (screenshot below) has half-length 61m. It has vector orientation [-0.97, -0.06, 0.25], which can be imagined as a 3D line between point [0,0,0] and [-0.97, -0.6, 0.25].
I want to see if its possible to write something to convert them into XYZ points on an ellipsoid surface.
Or Find the Max value for Axis 1, Axis 2, Axis 3 – which tells you the maximum location uncertainty in metres for each event. This will normally be Axis 3.
If you then look at Vector 3 Z it will usually be close to +1.0 or -1.0 (which are the maximum and minimum values). If it is close to +/- 1.0 it means that the axis is near vertical. If it is close to 0.0 then it is horizontal.
Surface monitoring networks normally have the greatest location uncertainty in depth.
These specific eigenvectors mean:
[X=0.0, Y=+/-1.0, Z=0.0] would be North/South (ie: the Y component is largest).
[X=+/-1.0, Y=0.0, Z=0.0] would be East/West (ie: X biggest)
[X=0.0, Y=0.0, Z=+/-1.0] would be vertical
I have 600+ rows and the aim is to look at the elliposids to make interpretations on there orientation and their distrubtion. Thank you for any help.
Hi
I have hundreds of Lidar Point cloud las files, which contains only one type of feature (such as electrical transformers, with no background features). I want to use those hundreds of transformer Poincloud datasets in las format, for creating training datasets for doing ML Lidar classification. How can I create labels for those hundres of pointcloud data in MATLAB?
Thanks Ray
Hi everyone,
I need assistance with a task related to combining two TLC (Target Language Compiler) files for model compilation. I have two TLC files, 'ert.tlc' and 'cnp.tlc,' which are essential for generating code from my Simulink model.
I would like to create a single 'combined.tlc' file that allows me to compile the model using both 'ert.tlc' and 'cnp.tlc.' However, I am facing some challenges in merging these files effectively.
I'm looking for guidance on how to:
- Combine 'ert.tlc' and 'cnp.tlc' into a single 'combined.tlc' file.
- Ensure that 'combined.tlc' appears in the Model Settings under the 'CodeGeneration' parameter.
This is important for me because my model is including some function blocks which is only supported to compile by cnp.tlc but also I have complie my model with ert.tlc because I want generate my model to ASAP2(.a2l).
Thanks for helping!
You are invited to join our 2023 community contest – MATLAB Flipbook Mini Hack! This year’s contest revolves around creating interesting animations using MATLAB.
Whether you are a seasoned MATLAB user or just getting started, this contest offers a fantastic opportunity to showcase your skills, learn from others, and engage with the vibrant MATLAB Central community.
Timeframe
This contest runs for 4 weeks from Nov. 6th to Dec. 3rd.
How to play
- Create a new animation or remix an existing one with up to 2,000 characters of code.
- Simply vote on the animations you love!
Prizes
You will have opportunities to win compelling prizes, including Amazon gift cards, MathWorks T-shirts, and virtual badges. We will give out both weekly prizes and grand prizes.


The MATLAB Central Community team