結果:
good afternoon everyone my name is Dundu lawan haruna ,i'm a final year student at the department of computer engineering ABU Zaria, Nigerian , and i wanted to do my final year project based on computer vision : project topic , designing an eye glasses to help those people with visual imparement to be able to navigate enviroment efficiently , that's why i need a support from you guys ,all advised are highly well come , thank you for your support.
Participants across all skill levels are welcome to join! You can participate by creating a new animation or remixing an existing one with up to 2,000 characters of MATLAB code.
Contest Tips:
- Before you start, we highly recommend you check out the two examples - Bouncing and Spinning - to understand how the contest works.
- Share your thoughts, ask questions, or connect with others in our contest discussion channel.
Note that the first week (Nov. 6th, 2023, ~ Nov. 12th, 2023) is for creating entries only. Voting does not begin until the second week.
We look forward to seeing your creative work. Let the contest begin!
Hi, Im new to here. I wanted to ask for assitance in plotting ellipsoids onto XYZ plots based on Excel data. The data shows details for seismic events but the analysis needs to be just looking into the data as points on a XYZ graph. I have no experience with Matlab and any help would be greatly appreciated.
The first column is to identify the point; Column B is the time of the event; Column C-E is the location of the point. Column D reflects the amount of energy released. Colums G-R are for eigenvalues and eigenvectors.
Each ellipsoid is described by the 3 semi-major axes, named 1, 2, 3 in our file.
The 3 columns Axis 1, Axis 2, Axis 3 are the length (eigenvalues) of the 3 semi-major axis in metres.
The next 9 columns define the semi-major axis vectors (eigenvectors), so for example [Vector 1 X, Vector 1 Y, Vector 1 Z] define the 3 direction cosines (XYZ) of the Axis 1 vector.
So for example:
Axis 1 of the ellipsoid for Trigger ID 1 (screenshot below) has half-length 61m. It has vector orientation [-0.97, -0.06, 0.25], which can be imagined as a 3D line between point [0,0,0] and [-0.97, -0.6, 0.25].
I want to see if its possible to write something to convert them into XYZ points on an ellipsoid surface.
Or Find the Max value for Axis 1, Axis 2, Axis 3 – which tells you the maximum location uncertainty in metres for each event. This will normally be Axis 3.
If you then look at Vector 3 Z it will usually be close to +1.0 or -1.0 (which are the maximum and minimum values). If it is close to +/- 1.0 it means that the axis is near vertical. If it is close to 0.0 then it is horizontal.
Surface monitoring networks normally have the greatest location uncertainty in depth.
These specific eigenvectors mean:
[X=0.0, Y=+/-1.0, Z=0.0] would be North/South (ie: the Y component is largest).
[X=+/-1.0, Y=0.0, Z=0.0] would be East/West (ie: X biggest)
[X=0.0, Y=0.0, Z=+/-1.0] would be vertical
I have 600+ rows and the aim is to look at the elliposids to make interpretations on there orientation and their distrubtion. Thank you for any help.
Hi
I have hundreds of Lidar Point cloud las files, which contains only one type of feature (such as electrical transformers, with no background features). I want to use those hundreds of transformer Poincloud datasets in las format, for creating training datasets for doing ML Lidar classification. How can I create labels for those hundres of pointcloud data in MATLAB?
Thanks Ray
Hi everyone,
I need assistance with a task related to combining two TLC (Target Language Compiler) files for model compilation. I have two TLC files, 'ert.tlc' and 'cnp.tlc,' which are essential for generating code from my Simulink model.
I would like to create a single 'combined.tlc' file that allows me to compile the model using both 'ert.tlc' and 'cnp.tlc.' However, I am facing some challenges in merging these files effectively.
I'm looking for guidance on how to:
- Combine 'ert.tlc' and 'cnp.tlc' into a single 'combined.tlc' file.
- Ensure that 'combined.tlc' appears in the Model Settings under the 'CodeGeneration' parameter.
This is important for me because my model is including some function blocks which is only supported to compile by cnp.tlc but also I have complie my model with ert.tlc because I want generate my model to ASAP2(.a2l).
Thanks for helping!

Share your fun photos in the comments!
Here's a MATLAB class I wrote that leverages the MATLAB Central Interface for MATLAB toolbox, which in turn uses the publicy available Community API. Using this class, I've created a few Favorites that show me what's going on in MATLAB Central - without having to leave MATLAB 🙂
The class has a few convenient queries:
- Results for the last 7 days
- Results for the last 30 days
- Results for the current month
- Results for today
And supporting a bunch of different content scopes:
- All MATLAB Central
- MATLAB Answers
- Blogs
- Cody
- Contests
- File Exchange
- Exclude Answers content
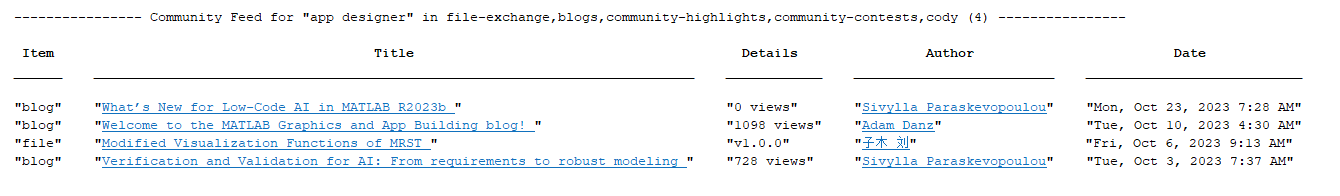
The results are displayed in the command window (which worked best for me) and link to each post. Here's what that looks like for this command
>> CommunityFeed.thisMonth("app designer", CommunityFeed.Scope.ExcludeAnswers)
Let me know if you find this class useful and feel free to suggest changes.
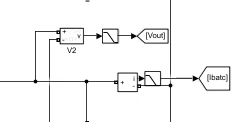
Hi guys, I've still can't figured it out the element behind the current and voltage measurement, does anyone know what element is this? Really appreciate for the answers. It will be very helpful for my fyp project.
hello,im student and my project is about creating a drive for ev using synchronous reluctance motor. for that i need one circuit in which i can check different parameters like speed, torque,etc. of different motors. i need one reference drive circuit in which i can replace motors and check their performance. hoping for help thank you :)
Hi all,
I want to solve an ode45 equation for a multibody model. The matrixes I have to implement in the ode45 are very big. Now I am using the subs function to place the values for x into the matrixes. However because the fact that this is done inside the ode45 function running the function takes a while. Is there a way to already implement the x value in the matrixes as a variable outside the ode45 function?
In the code WT and w_bar are matrixes of 12x15 and12x1
The vector hulp_vec and hulp_vec_derivative contain both 15 syms variables
% Solve the equation
[t,x]=ode45(@(t,x)analytical_simplified(t,x,M,H,S,WT,w_bar,N,constr_eq,hulp_vec,hulp_vec_derivative),tspan,x0);
function [dx, lambda, constraint_eq]=analytical_simplified(t,x,M,H,S,WT,w_bar,N,constraint_eq,hulp_vec,hulp_vec_derivative)
tic
tau=[0;sin(t);0];
%make matrices afhankelijk van x and dx
% WT=subs(WT,hulp_vec',x(1:N));
WT=subs(WT,hulp_vec_derivative',x(N+1:2*N));
w_bar=subs(w_bar,hulp_vec',x(1:N));
w_bar=subs(w_bar,hulp_vec_derivative',x(N+1:2*N));
constraint_eq=subs(constraint_eq,hulp_vec',x(1:N));
toc
tic
Minv=inv(M);
% Stabilize the matrixes
wo=100;
alpha=wo/5; beta=1;
w_bar_stab = w_bar + 2*alpha*beta*WT*x(N+1:2*N) + alpha^2*constraint_eq;
% w_bar_stab=w_bar;
L1=(WT*Minv*WT');
L2=(WT*Minv*(H-S*tau)-w_bar_stab);
L1=double(L1); L2=double(L2);
lambda=L1\L2;
ddx=Minv*(S*tau-H+WT'*lambda);
dx(1:N)=x(N+1:2*N);
dx(N+1:2*N)=ddx;
dx=dx';
dx=double(dx);
toc
end
With kind regards,
Janne
Good day community, can I know what is this symbol could be? It looks like a ramp/ continuous ramp. But I believe it is not both them. I saw someone connect it after a voltage/ current measurement. Can I know what is the function of this symbol too? Much appreciate for the answers given
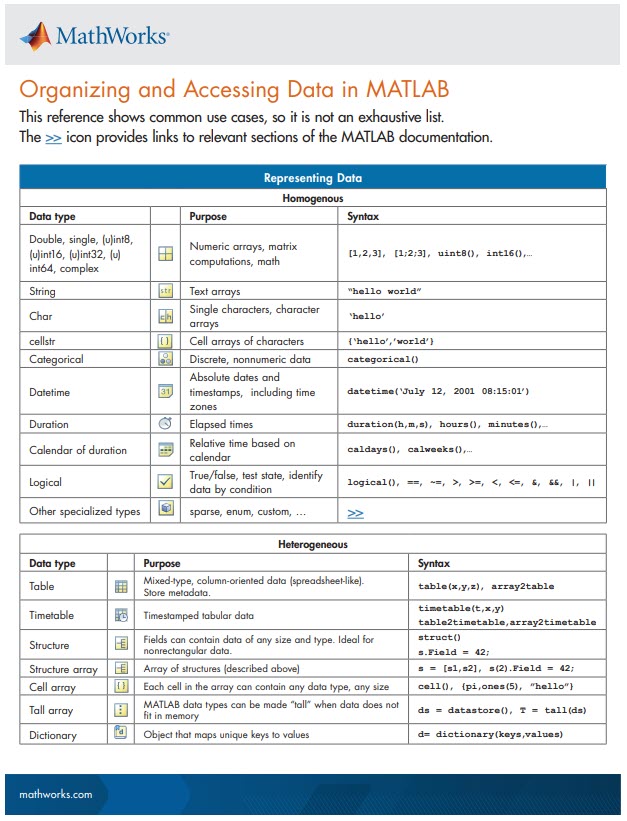
New Cheat Sheet Alert!
Level up your data organization and access skills in MATLAB with our latest cheat sheet! Download the full cheat sheet on MATLAB GitHub for Students here.
Hello All,
I was wondering, from which version Tracebility Diagrams are available (in SLK Req)?
Regards
Abhishek KUMAR
Hello, I am trying to use a Velodyne VLP 16 Puck Lidar, to receive live data (visualized) as well as point cloud, the issue I have is; I do actually run the code to visualize the lidar and I can see the live map, as well as I get frames in the work space as (1x1 Pointcloud), now how can I process these pointclouds(from the live stream of lidar), I would like to denoise them, downsample, etc. I tried going through alot of toolboxes but I usually get stuck, need tips and how to start working, thanks.,
unable to download and cant install Arduino third party packages , but support packeages are download, 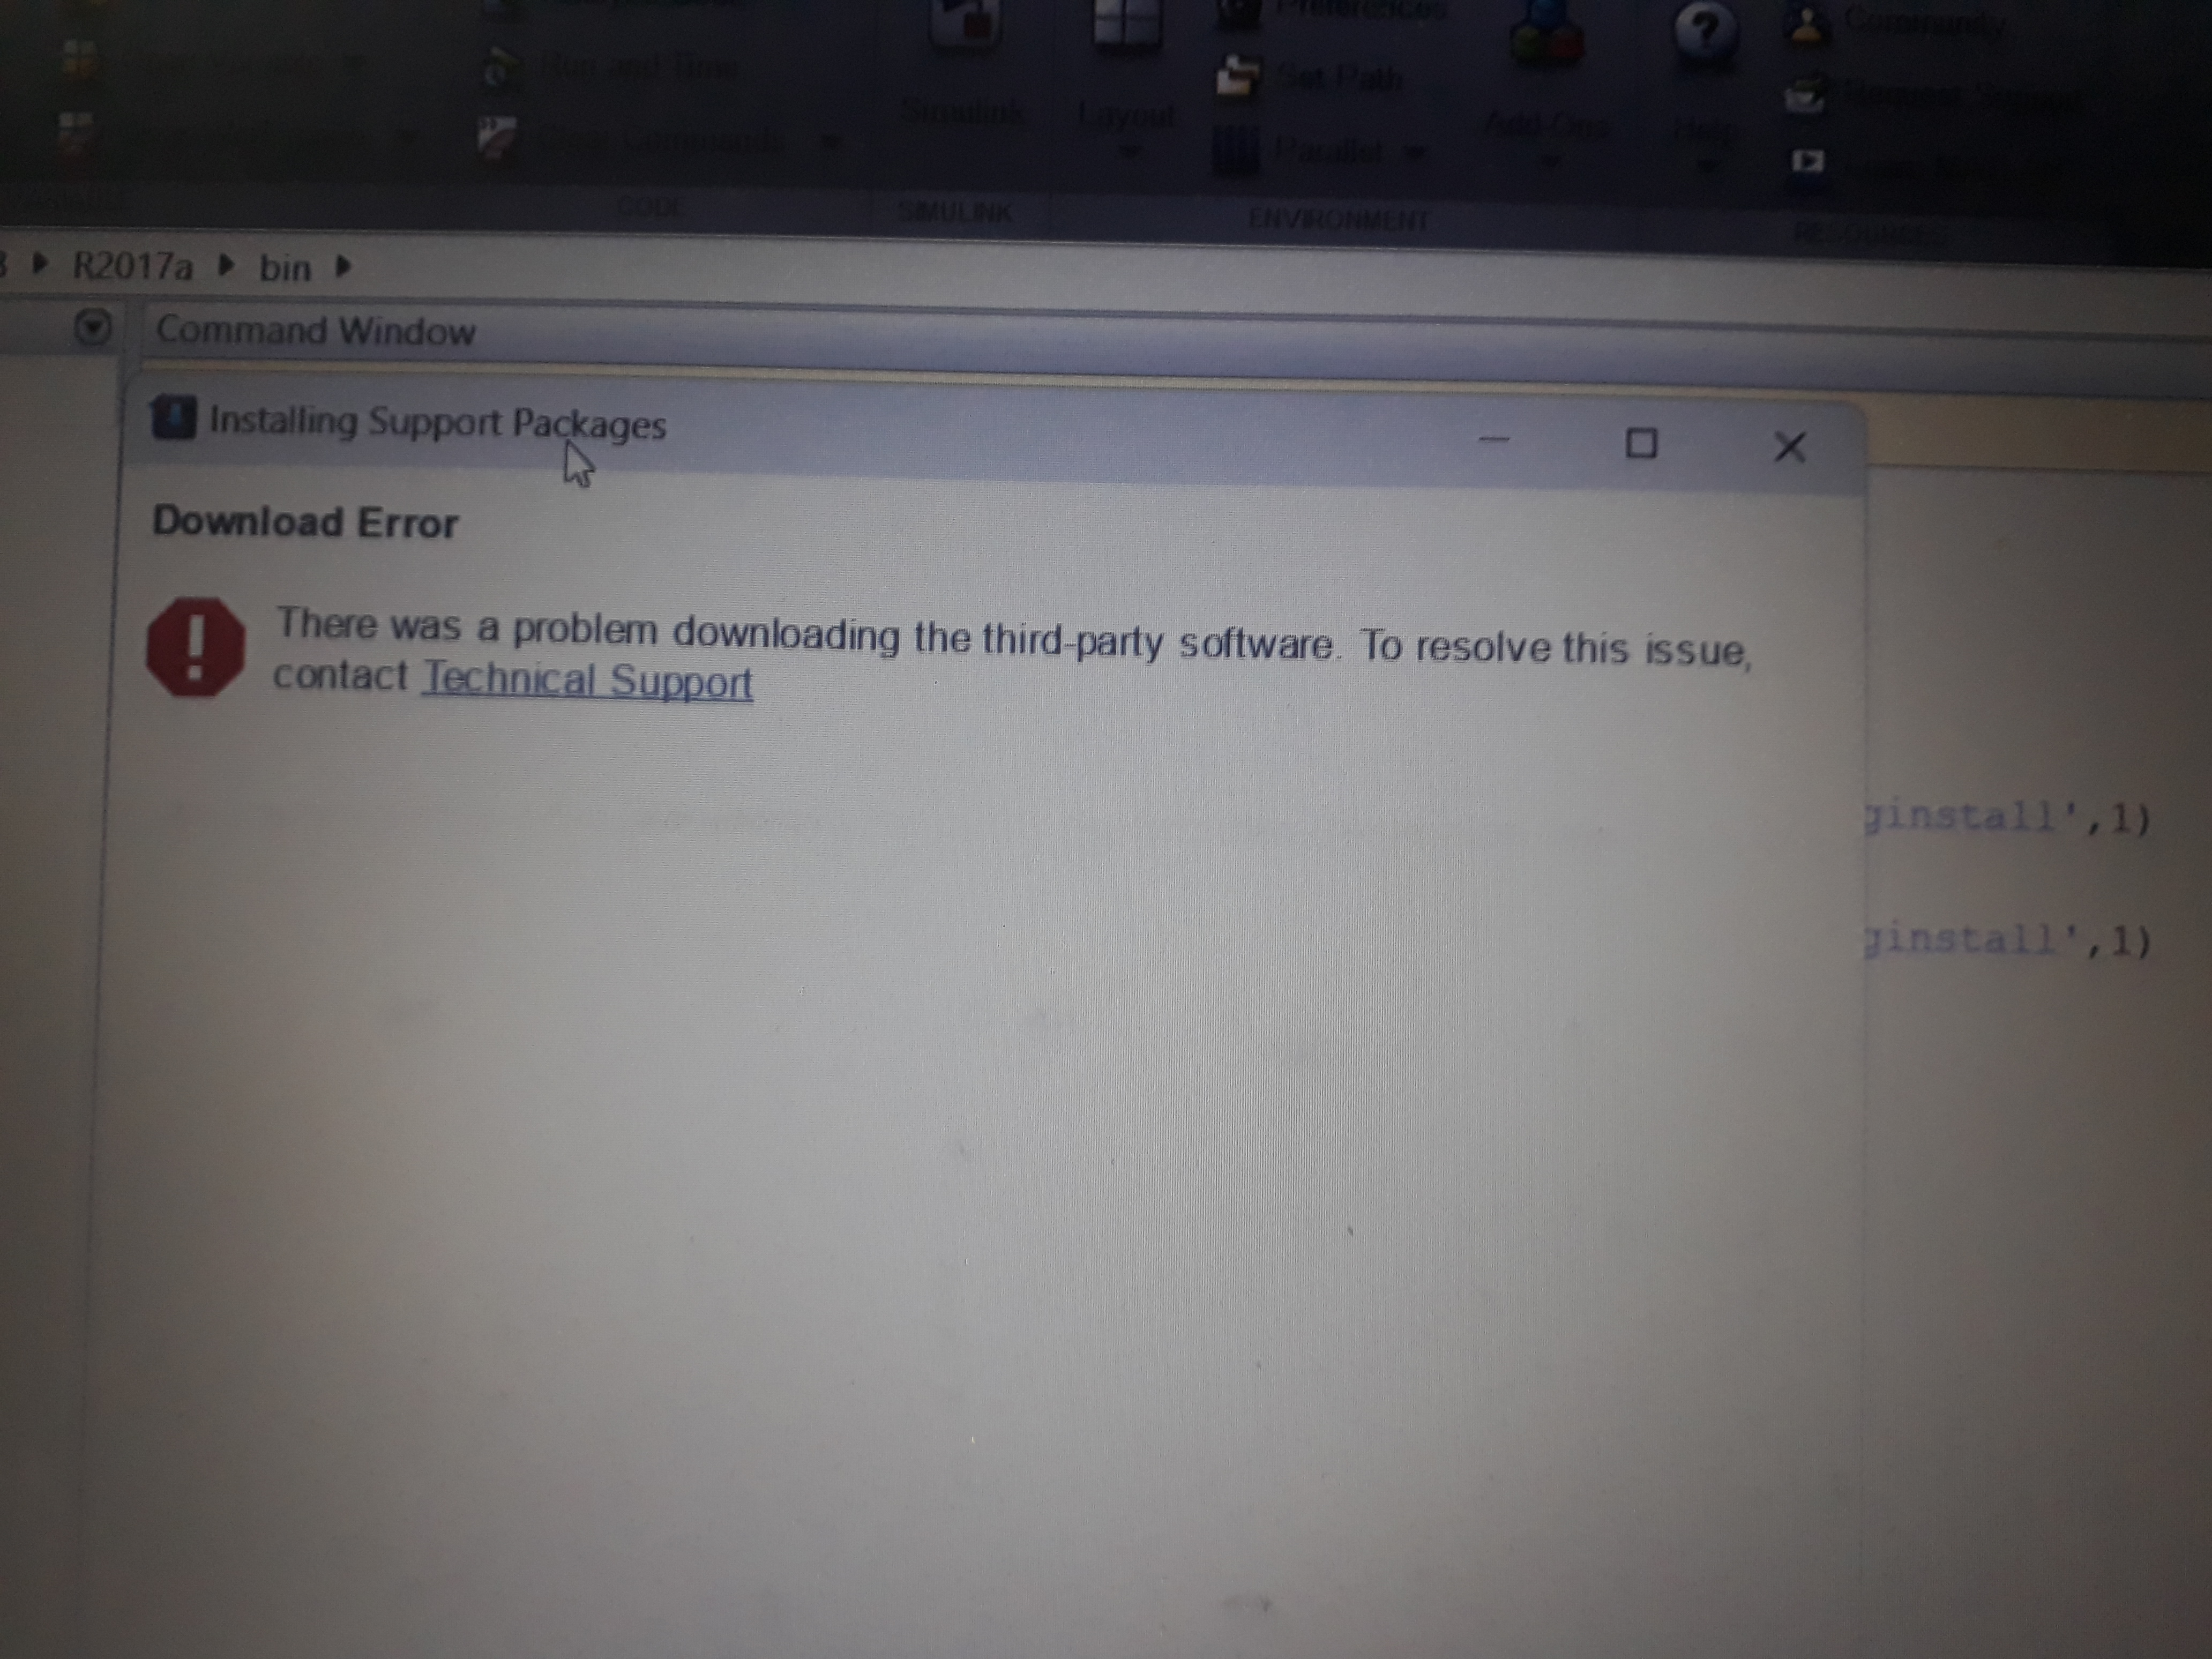
- Why do the stations transmit to each other while there is no association among them?
- How the stations transmit to the access point while the traffic generation is one way?
please find the attached code"ex1_AP_STA.m" and output data of simulator "Simulation data.zip"
when i use command openExample('px4/PX4HITLSimulationFixedWingPlantSimulinkExample'),matlab shows "PX4HITLSimulationFixedWingPlantSimulinkExample" cannot find. So does somebody know how to find this demo? Thanks.
ncorr is not working on MATLAB 2023b new version, it gives me an error. Does somebody know why? Thanks
I know the latest version of MATLAB R2023b has this feature already, put it should be added to R2023a as well because of its simplicity and convenience.
Basically, I want to make a bar graph that lets me name each column in a basic bar graph:
y=[100 99 100 200 200 300 500 800 1000];
x=["0-4" "5-17" "18-29" "30-39" "40-49" "50-64" "65-74" "75-84" "85+"];
bar(x,y)
However, in R2023a, this isn't a feature. I think it should be added because it helps to present data and ideas more clearly and professionally, which is the purpose of a graph to begin with.