深層学習用点群データの符号化
畳み込みニューラル ネットワークを点群データと共に使用する場合、特定の主要な処理 (畳み込みなど) には、空間的に規則的にサンプリングされた入力データが必要です。空間的に規則的にサンプリングされていない点群データや LIDAR データは、前処理パイプラインのどこかで、規則的にサンプリングされた構造に変換しなければなりません。点群データを高密度でグリッド化された構造に変換するには、さまざまな方法があります [1][2][3]。この例では、ボクセル化という簡単な方法を説明します。
点群データのボクセル化
まず、Sydney Urban Objects Dataset を使用するために、データストアを定義します。
dataPath = downloadSydneyUrbanObjects(tempdir);
ds = loadSydneyUrbanObjectsData(dataPath);
データストアからサンプル出力データを取得します。
data = preview(ds);
disp(data)
{1×1 pointCloud} {[4wd]}
データストアのサンプル出力データを表示します。
figure
ptCloud = data{1};
pcshow(ptCloud);
label = string(data{2});
title(label);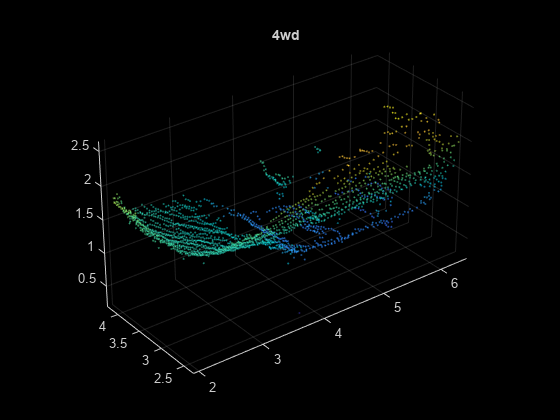
Warning: An error occurred while drawing the scene: GraphicsView error in command: interactionsmanagermessage:  TypeError: Cannot read properties of null (reading '_gview')
    at new g (https://127.0.0.1:31515/toolbox/matlab/uitools/figurelibjs/release/bundle.mwBundle.gbtfigure-lib.js?mre=https
関数 pcbin を使用して、pointCloud 入力オブジェクトの座標系に対する、任意の規則的な 3 次元グリッド化を定義します。また、pcbin を使用すると、出力として cell 配列が返されます。この配列には、入力 pointCloud の各点のビンの空間的な位置が含まれています。この例では、入力 pointCloud は [32,32,32] サイズの出力グリッドでビン化されます。このグリッドは、入力 pointCloud の XLimits、YLimits、および ZLimits までが範囲となります。
outputGridSize = [32,32,32];
bins = pcbin(data{1},outputGridSize);
bins の各 cell には、特定の点の位置に該当する ptCloud.Location の点のインデックスが含まれています。MATLAB® 関数 cellfun を使用すると、bins を入力として使用する点群データの一般的な符号化を定義できます。
occupancyGrid = cellfun(@(c) ~isempty(c),bins);
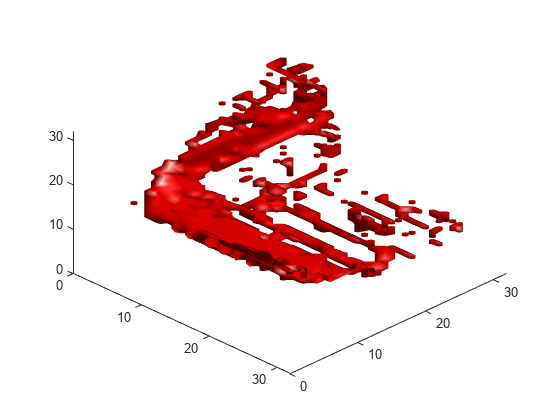
3 次元占有グリッドを定義します。このグリッドでは、少なくとも 1 つの点によって占められたグリッド位置は true となり、そうでない場合は false となります。
figure;
p = patch(isosurface(occupancyGrid,0.5));
view(45,45);
p.FaceColor = "red";
p.EdgeColor = "none";
camlight;
lighting phong
データストアを変換して点群の符号化をデータセット全体に適用する
データストアの関数 transform を使用して、入力データストアの各観測値に単純な占有グリッドの符号化を適用します。サポート関数の節に含まれている関数 formOccupancyGrid は、上記の pcbin とまったく同じ方法を使用します。
dsTransformed = transform(ds,@formOccupancyGrid);
exampleOutputData = preview(dsTransformed);
disp(exampleOutputData);
{32×32×32 logical} {[4wd]}
得られたデータストア dsTransformed は、trainnet や DataLoader などの深層学習インターフェイスに渡して、深層ニューラル ネットワークの学習に使用できます。
参考文献
[1] Maturana, D. and Scherer, S., VoxNet: A 3D Convolutional Neural Network for Real-Time Object Recognition, IROS 2015.
[2] AH Lang, S Vora, H Caesar, L Zhou, J Yang, O Beijbom, PointPillars: Fast Encoders for Object Detection from Point Clouds, CVPR 2019
[3] Charles R. Qi, Hao Su, Kaichun Mo, Leonidas J. Guibas, PointNet: Deep Learning on Point Sets for 3D Classification and Segmentation, CVPR 2017
サポート関数
function datasetPath = downloadSydneyUrbanObjects(dataLoc)

if nargin == 0
    dataLoc = pwd();
end

dataLoc = string(dataLoc);

url = "http://www.acfr.usyd.edu.au/papers/data/";
name = "sydney-urban-objects-dataset.tar.gz";

if ~exist(fullfile(dataLoc,"sydney-urban-objects-dataset"),"dir")
    disp("Downloading Sydney Urban Objects Dataset...");
    untar(url + name,dataLoc);
end

datasetPath = dataLoc.append("sydney-urban-objects-dataset");

end

function ds = loadSydneyUrbanObjectsData(datapath,folds)
% loadSydneyUrbanObjectsData Datastore with point clouds and
% associated categorical labels for Sydney Urban Objects dataset.
%
% ds = loadSydneyUrbanObjectsData(datapath) constructs a datastore that
% represents point clouds and associated categories for the Sydney Urban
% Objects dataset. The input, datapath, is a string or char array which
% represents the path to the root directory of the Sydney Urban Objects
% Dataset.
%
% ds = loadSydneyUrbanObjectsData(___,folds) optionally allows
% specification of desired folds that you wish to be included in the
% output ds. For example, [1 2 4] specifies that you want the first,
% second, and fourth folds of the Dataset. Default: [1 2 3 4].

if nargin < 2
    folds = 1:4;
end

datapath = string(datapath);
path = fullfile(datapath,"objects",filesep);

% For now, include all folds in Datastore
foldNames{1} = importdata(fullfile(datapath,"folds","fold0.txt"));
foldNames{2} = importdata(fullfile(datapath,"folds","fold1.txt"));
foldNames{3} = importdata(fullfile(datapath,"folds","fold2.txt"));
foldNames{4} = importdata(fullfile(datapath,"folds","fold3.txt"));
names = foldNames(folds);
names = vertcat(names{:});

fullFilenames = append(path,names);
ds = fileDatastore(fullFilenames,ReadFcn=@extractTrainingData,FileExtensions=".bin");

end

function dataOut = extractTrainingData(fname)

[pointData,intensity] = readbin(fname);

[~,name] = fileparts(fname);
name = string(name);
name = extractBefore(name,".");

labelNames = ["4wd","bench","bicycle","biker",...
    "building","bus","car","cyclist","excavator","pedestrian","pillar",...
    "pole","post","scooter","ticket_machine","traffic_lights","traffic_sign",...
    "trailer","trash","tree","truck","trunk","umbrella","ute","van","vegetation"];

label = categorical(name,labelNames);

dataOut = {pointCloud(pointData,"Intensity",intensity),label};

end

function [pointData,intensity] = readbin(fname)
% readbin Read point and intensity data from Sydney Urban Object binary
% files.

% names = ["t","intensity","id",...
%          "x","y","z",...
%          "azimuth","range","pid"]
%
% formats = ["int64", "uint8", "uint8",...
%            "float32", "float32", "float32",...
%            "float32", "float32", "int32"]

fid = fopen(fname, "r");
c = onCleanup(@() fclose(fid));

fseek(fid,10,-1); % Move to the first X point location 10 bytes from beginning
X = fread(fid,inf,"single",30);
fseek(fid,14,-1);
Y = fread(fid,inf,"single",30);
fseek(fid,18,-1);
Z = fread(fid,inf,"single",30);

fseek(fid,8,-1);
intensity = fread(fid,inf,"uint8",33);

pointData = [X,Y,Z];

end

function dataOut = formOccupancyGrid(data)

grid = pcbin(data{1},[32 32 32]);
occupancyGrid = cellfun(@(c) ~isempty(c),grid);
label = data{2};
dataOut = {occupancyGrid,label};

end