Plot a Histogram with a Distribution Fit
This example shows how to fit a distribution to data in a ThingSpeak™ channel. You simultaneously generate a histogram and a fit to the distribution for traffic density data for a highway in Massachusetts.
Read Data from the Car-Counter ThingSpeak Channel
The car-counter ThingSpeak channel uses a Raspberry Pi™ and a webcam to count cars on a busy highway. A car-counting algorithm is running on the Raspberry Pi, and the density of cars counted every 15 seconds is sent to ThingSpeak. Fields 1 and 2 contain eastbound and westbound traffic data, respectively.
data = thingSpeakRead(38629,'NumDays',1,'Fields',[1,2],'outputFormat','table');
Filter Your Data
Before fitting the distribution, filter your data to remove zeros.
data_without_zeros = data.DensityOfEastboundCars(data.DensityOfEastboundCars > 0);
Plot Histogram and Fit Distribution
Visualize the eastbound traffic data as a histogram and fit a distribution such as normal, poisson, gamma, or kernel. Visualizing the data helps you to understand the shape of the underlying distribution. Fit a nonparametric kernel smoothing distribution.
number_of_bins = 20;
histfit(data_without_zeros,number_of_bins,'kernel');
xlabel('Bins for density of cars every 15 seconds');
title('Fitting Kernel Function on Distribution of Eastbound Cars in the Past Day');
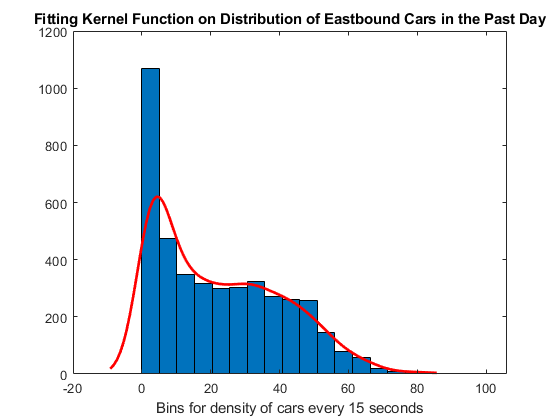
The histogram and fit show that the distribution is skewed to the right.
See Also
Functions
histfit(Statistics and Machine Learning Toolbox) |thingSpeakRead