ワード クラウドを使用したテキスト データの可視化
この例では、ワード クラウドを使用してテキスト データを可視化する方法を示します。
Text Analytics Toolbox は、関数 wordcloud (MATLAB) の機能を拡張します。string 配列から直接ワード クラウドを作成し、bag-of-words モデルと LDA トピックからワード クラウドを作成するためのサポートが追加されています。
サンプル データを読み込みます。ファイル factoryReports.csv には、各イベントの説明テキストとカテゴリカル ラベルを含む工場レポートが格納されています。
filename = "factoryReports.csv";
tbl = readtable(filename,'TextType','string');
Description 列からテキスト データを抽出します。
textData = tbl.Description;
textData(1:10)
ans = 10×1 string array
    "Items are occasionally getting stuck in the scanner spools."
    "Loud rattling and banging sounds are coming from assembler pistons."
    "There are cuts to the power when starting the plant."
    "Fried capacitors in the assembler."
    "Mixer tripped the fuses."
    "Burst pipe in the constructing agent is spraying coolant."
    "A fuse is blown in the mixer."
    "Things continue to tumble off of the belt."
    "Falling items from the conveyor belt."
    "The scanner reel is split, it will soon begin to curve."
レポートからワード クラウドを作成します。
figure
wordcloud(textData);
title("Factory Reports")
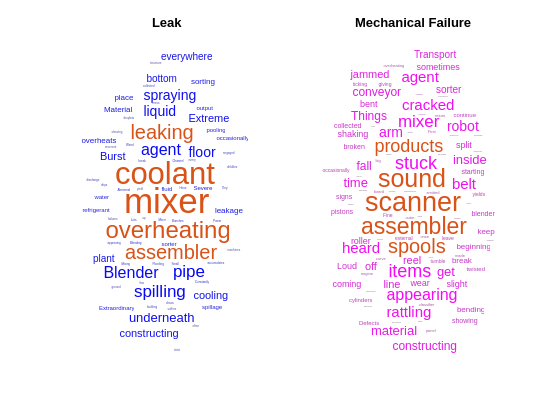
ラベル "Leak" とラベル "Mechanical Failure" でレポート内の単語を比較します。これらのラベルごとに、レポートのワード クラウドを作成します。各ワード クラウドの単語の色をそれぞれ青とマゼンタに指定します。
figure
labels = tbl.Category;

subplot(1,2,1)
idx = labels == "Leak";
wordcloud(textData(idx),'Color','blue');
title("Leak")

subplot(1,2,2)
idx = labels == "Mechanical Failure";
wordcloud(textData(idx),'Color','magenta');
title("Mechanical Failure")
緊急度 "Low"、"Medium"、および "High" でレポート内の単語を比較します。
figure
urgency = tbl.Urgency;

subplot(1,3,1)
idx = urgency == "Low";
wordcloud(textData(idx));
title("Urgency: Low")

subplot(1,3,2)
idx = urgency == "Medium";
wordcloud(textData(idx));
title("Urgency: Medium")

subplot(1,3,3)
idx = urgency == "High";
wordcloud(textData(idx));
title("Urgency: High")

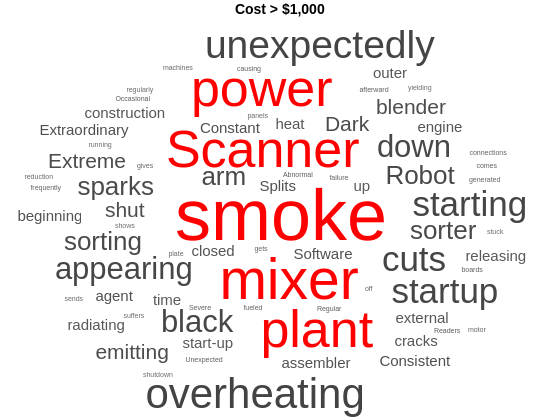
百ドル単位のコストが報告されているレポートと、千ドル単位のコストが報告されているレポートの単語を比較します。これらの金額ごとにレポートのワード クラウドを作成し、それぞれの強調色を青と赤にします。
cost = tbl.Cost;
idx = cost > 100;
figure
wordcloud(textData(idx),'HighlightColor','blue');
title("Cost > $100")

idx = cost > 1000;
figure
wordcloud(textData(idx),'HighlightColor','red');
title("Cost > $1,000")
参考
wordcloud | tokenizedDocument | bagOfWords