Main Content

Battery

Generic battery model

  • Battery block

Libraries:
Simscape / Electrical / Specialized Power Systems / Sources

Description

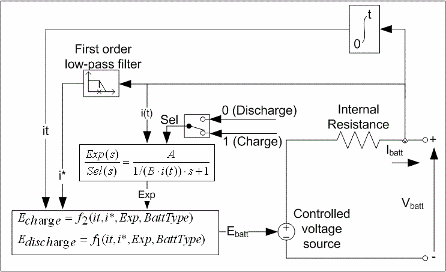
The Battery block implements a generic dynamic model that represents most popular types of rechargeable batteries.

This figure shows the equivalent circuit that the block models.

Charge and Discharge Characteristics

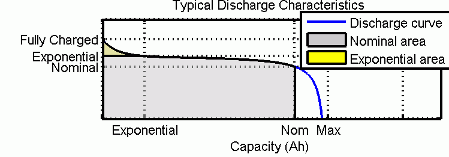
The circuit parameters can be modified to represent a specific battery type and its discharge characteristics. A typical discharge curve consists of three sections.

The first section represents the exponential voltage drop when the battery is charged. The width of the drop depends on the battery type. The second section represents the charge that can be extracted from the battery until the voltage drops below the battery nominal voltage. Finally, the third section represents the total discharge of the battery, when the voltage drops rapidly.

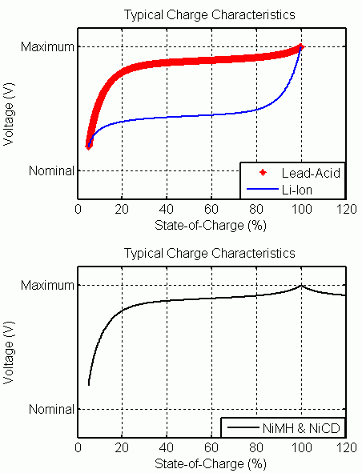
When the battery current is negative, the battery recharges, following a charge characteristic.

The model parameters are derived from the discharge characteristics. The discharging and charging characteristics are assumed to be the same.

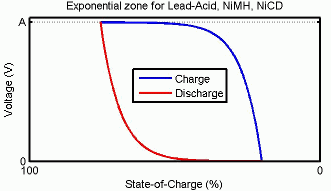
The Exp(s) transfer function represents the hysteresis phenomenon for the lead-acid, nickel-cadmium (NiCD), and nickel-metal hydride (NiMH) batteries during the charge and discharge cycles. The exponential voltage increases when a battery is charging, regardless of the battery's state of charge. When the battery is discharging, the exponential voltage decreases immediately.

The state of charge (SOC) for a battery is a measure of battery's charge, expressed as a percent of the full charge. The depth of discharge (DOD) is the numerical complement of the SOC, such that DOD = 100% - SOC.

For example, if the SOC is:

  • 100% — The battery is fully charged and the DOD is 0%.

  • 75% — The battery is 3/4 charged and the DOD is 25%.

  • 50% — The battery is 1/2 charged and the DOD is 50%.

  • 0% — The battery is has 0 charge and the DOD is 100%.

Model Validation

Experimental validation of the model shows a maximum error of 5% (when SOC is between 10% and 100%) for the charge (when the current is 0 through 2 C) and discharge (when the current is 0 through 5 C) dynamics.

Parameterization

Extract Battery Parameters from Data Sheets

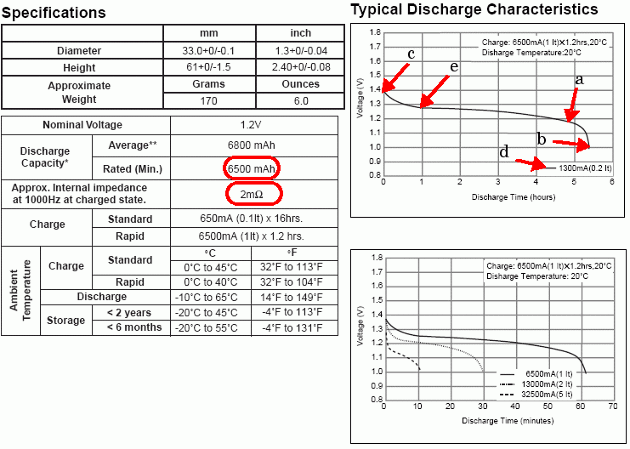
This figure shows detailed parameters extracted from the Panasonic NiMH-HHR650D battery data sheet.

You can obtain the rated capacity and the internal resistance from the specification tables. The other detailed parameters are derived from the Typical Discharge Characteristics plot.

Parameter

Value

Rated Capacity

6.5 Ah

Internal Resistance

2

Nominal Voltage (a)

1.18 V

Rated Capacity

6.5 Ah

Maximum Capacity (b)

7 Ah (5.38 h * 1.3 A)

Fully Charged Voltage (c)

1.39 V

Nominal Discharge Current (d)

1.3 A

Capacity @ Nominal Voltage (a)

6.25 Ah

Exponential Voltage (e)

1.28 V

Exponential Capacity (e)

1.3 Ah

These parameters are approximate and depend on the precision of the points obtained from the discharge curve.

The discharge curves you obtain from these parameters, which are marked by dotted lines in the following figures, are similar to the data sheet curves.

Model cells in Series and/or in Parallel

To model a series and/or parallel combination of cells based on the parameters of a single cell, use the parameter transformation shown in the following table can be used. The Nb_ser variable corresponds to the number of cells in series, and Nb_par corresponds to the number of cells in parallel.

ParameterValue

Nominal voltage

1.18 * Nb_ser

Rated capacity

6.5 * Nb_par

Maximum capacity

7 * Nb_par

Fully charged voltage

1.39 * Nb_ser

Nominal discharge current

1.3 * Nb_par

Internal resistance

0.002 * Nb_ser/Nb_par

Capacity at nominal voltage

6.25 * Nb_par

Exponential zone

1.28 * Nb_ser, 1.3 * Nb_par

Equations

For the lead-acid battery type, the model uses these equations.

  • Discharge Model (i* > 0)

    f1(it,i*,i,Exp)=E0KQQiti*KQQitit+Laplace1(Exp(s)Sel(s)0)

  • Charge Model (i* < 0)

    f2(it,i*,i,Exp)=E0KQit+0.1Qi*KQQitit+Laplace1(Exp(s)Sel(s)1s)

    with it > 0 during charging.

For the lithium-ion battery type, the model uses these equations.

  • Discharge Model (i* > 0)

    f1(it,i*,i)=E0KQQiti*KQQitit+Aexp(Bit)

  • Charge Model (i* < 0)

    f2(it,i*,i)=E0KQit+0.1Qi*KQQitit+Aexp(Bit)

For the nickel-cadmium and nickel-metal-hydride battery types, the model uses these equations.

  • Discharge Model (i* > 0)

    f1(it,i*,i,Exp)=E0KQQiti*KQQitit+Laplace1(Exp(s)Sel(s)0)

  • Charge Model (i* < 0)

    f2(it,i*,i,Exp)=E0KQ|it|+0.1Qi*KQQitit+Laplace1(Exp(s)Sel(s)1s).

    In the equations:

    • EBatt is the nonlinear voltage, in V.

    • E0 is the constant voltage, in V.

    • Exp(s) is the exponential zone dynamics, in V.

    • Sel(s) represents the battery mode. Sel(s) = 0 during battery discharge, Sel(s) = 1 during battery charging.

    • K is the polarization constant, in V/Ah, or polarization resistance, in Ohms.

    • i* is the low-frequency current dynamics, in A.

    • i is the battery current, in A.

    • it is the extracted capacity, in Ah.

    • Q is the maximum battery capacity, in Ah.

    • A is the exponential voltage, in V.

    • B is the exponential capacity, in Ah−1.

Examples

Limitations and Assumptions

Limitations

  • The minimum no-load battery voltage is 0 V and the maximum battery voltage is equal to 2 × E0.

  • The minimum capacity of the battery is 0 Ah and the maximum capacity is Qmax.

Assumptions

  • The internal resistance is assumed to be constant during the charge and discharge cycles and does not vary with the amplitude of the current.

  • The parameters of the model are derived from the discharge characteristics. The discharging and charging characteristics are assumed to be the same.

  • The capacity of the battery does not change with the amplitude of the current (there is no Peukert effect).

  • The self-discharge of the battery is not represented. It can be represented by adding a large resistance in parallel with the battery terminals.

  • The battery has no memory effect.

Ports

Output

expand all

Output vector of signals for the battery temperature, state-of-charge, current and voltage. To demultiplex the signals, you can use a Bus Selector block.

Signal

Definition

Units

Cell Temperature

The cell or internal temperature

°C
SOC

Battery SOC, represented as a percentage (between 0 and 100%). The SOC is 100% for a fully charged battery and 0% for an empty battery. The SOC is calculated as:

SOC=100(11Q0ti(t)dt).

%
CurrentBattery currentA
VoltageBattery voltageV

Conserving

expand all

Specialized electrical conserving port associated with the battery's positive terminal.

Specialized electrical conserving port associated with the battery's negative terminal.

Parameters

expand all

Parameters

Battery model. The block provides predetermined charge behavior for four battery types. For the Lithium-Ion battery, the block provides models for simulating temperature and aging effects.

Nominal voltage, Vnom, of the battery, in V. The nominal voltage represents the end of the linear zone of the discharge characteristics.

Rated capacity, Qrated, of the battery, in Ah. The rated capacity is the minimum effective capacity of the battery.

State-of-charge (SOC) of the battery, expressed as a percentage of the maximum potential charge, at the beginning of simulation. An SOC of 100% indicates a fully charged battery and 0% indicates an empty battery.

The specified value does not affect the discharge curve that the block generates if, in the Discharge settings, you click Plot.

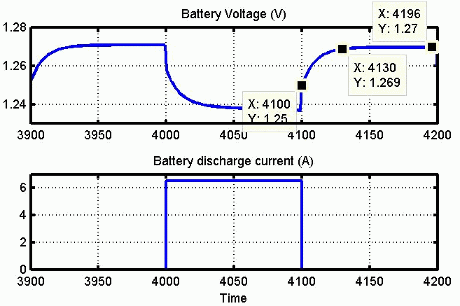
Response time of the battery, in s, at 95% of the final value. This value represents the voltage dynamics and can be observed when a current step is applied.

The plots show the voltage and discharge current for a battery with a response time of 30 s.

Discharge

Select to have the block determine the parameters in the Discharge settings based on the values specified for the parameters in the Parameters settings.

Dependencies

Selecting this parameter disables the parameters in the Discharge settings.

Maximum theoretical capacity, Q, when a discontinuity occurs in the battery voltage, in Ah. This value is generally equal to 105% of the rated capacity.

Minimum allowable battery voltage, in V. This voltage represents the end of the discharge characteristics. At the cut-off voltage, the battery is fully discharged.

Fully charged voltage, Vfull, for a given discharge current. The fully charged voltage is not the no-load voltage.

Nominal discharge current, in A, for which the discharge curve is measured.

For example, a typical discharge current for a 1.5-Ah NiMH battery is 20% of the rated capacity: (0.2 * 1.5 Ah / 1 h = 0.3 A).

Internal resistance of the battery, in ohms. When a preset model is used, a generic value is loaded that corresponds to 1% of the nominal power (nominal voltage multiplied by the battery rated capacity). The resistance is constant during the charge and the discharge cycles and does not vary with the amplitude of the current.

Capacity, Qnom, extracted from the battery until the voltage drops under the nominal voltage. This value should be between Qexp and Qmax.

Voltage, Vexp, and the capacity, Qexp, that correspond to the end of the exponential zone. The voltage should be between Vnom and Vfull. The capacity should be between 0 and Qnom.

References

[1] Omar N., M. A. Monem, Y. Firouz, J. Salminen, J. Smekens, O. Hegazy, H. Gaulous, G. Mulder, P. Van den Bossche, T. Coosemans, and J. Van Mierlo. “Lithium iron phosphate based battery — Assessment of the aging parameters and development of cycle life model.” Applied Energy, Vol. 113, January 2014, pp. 1575–1585.

[2] Saw, L.H., K. Somasundaram, Y. Ye, and A.A.O. Tay, “Electro-thermal analysis of Lithium Iron Phosphate battery for electric vehicles.” Journal of Power Sources. Vol. 249, pp. 231–238.

[3] Tremblay, O., L.A. Dessaint, "Experimental Validation of a Battery Dynamic Model for EV Applications." World Electric Vehicle Journal. Vol. 3, May 13–16, 2009.

[4] Zhu, C., X. Li, L. Song, and L. Xiang, “Development of a theoretically based thermal model for lithium ion battery pack.” Journal of Power Sources. Vol. 223, pp. 155–164.

Extended Capabilities

C/C++ Code Generation
Generate C and C++ code using Simulink® Coder™.

Version History

Introduced in R2008a

expand all