ピーク幅の特定
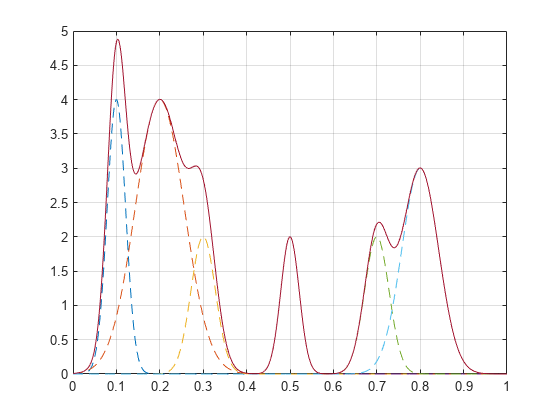
ガウス曲線の和を構成する信号を作成します。各曲線の位置、高さ、幅を指定します。
x = linspace(0,1,1000);

Pos = [1 2 3 5 7 8]'/10;
Hgt = [7 6 3 2 2 3]';
Wdt = [3 8 4 3 4 6]'/100;

y = sum(Hgt.*(exp(-((x-Pos)./Wdt).^2)),1);
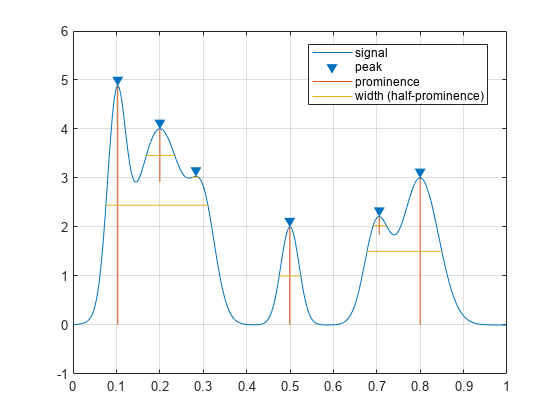
プロミネンスの半分および高さの半分を基準として使用し、ピークの幅を測定します。
tiledlayout("flow")
nexttile
findpeaks(y,x,Annotate="extents")
title("Half-Prominence Peak Widths")
nexttile
findpeaks(y,x,Annotate="extents",WidthReference="halfheight")
title("Half-Height Peak Widths")
"x" 軸で少なくとも 0.5 単位の間隔がある、最も高いピークを選択します。プロミネンスの半分および高さの半分を基準として使用し、ピークの幅を測定します。
figure
tiledlayout("flow")
nexttile
findpeaks(y,x,MinPeakDistance=0.5,Annotate="extents")
title("Half-Prominence Peak Widths")
nexttile
findpeaks(y,x,MinPeakDistance=0.5,Annotate="extents", ...
    WidthReference="halfheight")
title("Half-Height Peak Widths")
最小間隔の条件を満たすのは最初と最後のピークのみであるため、プロットに表示されるピーク幅はこれら 2 つのピークに対応します。各ピークの範囲は変化しないため、指定された条件や、そのピークが選択されたかどうかにかかわらず、ピーク幅の値は保持されます。