メインコンテンツ

generate

クラス: sigwin.hamming
名前空間: sigwin

ハミング ウィンドウの生成

構文

win = generate(H)

説明

win = generate(H) では、ハミング ウィンドウ オブジェクトの値が倍精度の列ベクトルとして返されます。

すべて展開する

2 つのハミング ウィンドウの生成:

  • 最初のウィンドウは N = 64 で、対称です。

  • 2 番目のウィンドウは N = 63 で、周期的です。

2 つのウィンドウを表示します。

Hs = sigwin.hamming(64,'symmetric');
Hp = sigwin.hamming(63,'periodic')
Hp = 
            Name: 'Hamming'
    SamplingFlag: 'periodic'
          Length: 63

wvt = wvtool(Hs,Hp);
legend(wvt.CurrentAxes,'Symmetric','Periodic')

Figure Window Visualization Tool contains 2 axes objects and other objects of type uimenu, uitoolbar, uipanel. Axes object 1 with title Time domain, xlabel Samples, ylabel Amplitude contains 2 objects of type line. Axes object 2 with title Frequency domain, xlabel Normalized Frequency (\times\pi rad/sample), ylabel Magnitude (dB) contains 2 objects of type line. These objects represent Symmetric, Periodic.

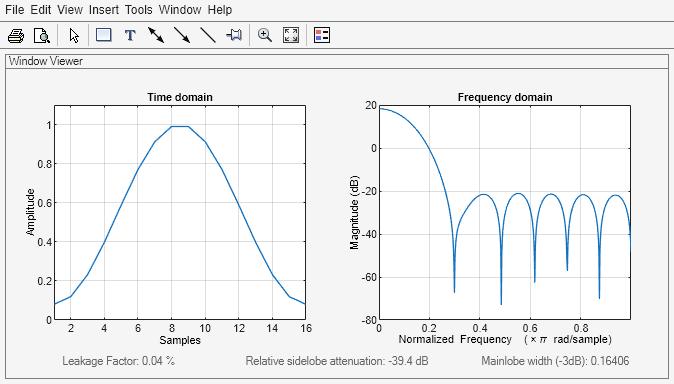
N = 16 の対称ハミング ウィンドウを生成します。ウィンドウの値を列ベクトルとして返します。ウィンドウ オブジェクトに関する情報が表示されます。ウィンドウを表示します。

H = sigwin.hamming(16);

win = generate(H)
win = 16×1

    0.0800
    0.1198
    0.2322
    0.3979
    0.5881
    0.7700
    0.9121
    0.9899
    0.9899
    0.9121
    0.7700
    0.5881
    0.3979
    0.2322
    0.1198
      ⋮

wininfo = info(H)
wininfo = 4×26 char array
    'Hamming Window            '
    '--------------            '
    'Length         : 16       '
    'Sampling Flag  : symmetric'

wvtool(H)

Figure Window Visualization Tool contains 2 axes objects and other objects of type uimenu, uitoolbar, uipanel. Axes object 1 with title Time domain, xlabel Samples, ylabel Amplitude contains an object of type line. Axes object 2 with title Frequency domain, xlabel Normalized Frequency (\times\pi rad/sample), ylabel Magnitude (dB) contains an object of type line.