このページは機械翻訳を使用して翻訳されました。最新版の英語を参照するには、ここをクリックします。
FieldOfView
衛星シナリオに属する視野オブジェクト
説明
FieldOfView オブジェクトは、衛星シナリオに属する視野オブジェクトを定義します。
視野オブジェクトを使用して、円錐形センサーの視野を可視化できます。センサーの視野を定義する円錐領域と地球の交線を表すコンターを地球上に描画します。実際のシナリオで視野オブジェクトを使用する方法の詳細については、衛星コンスタレーション地上局へのアクセス を参照してください。
作成
ConicalSensor オブジェクトの fieldOfView オブジェクト関数を使用して FieldOfView オブジェクトを作成できます。
プロパティ
ビュー コンターの視覚的な幅(ピクセル単位)。範囲(0~10)のスカラーとして指定します。
ライン幅をピクセルの幅より細くすることはできません。システムでライン幅をピクセルの幅より細い値に設定すると、ラインは 1 ピクセル幅で表示されます。
ビュー コンターの色。RGB トリプレット、16 進カラー コード、色名、または短縮名として指定します。
カスタム色を使用する場合は、RGB 3 成分または 16 進数カラー コードを指定します。
RGB 3 成分は、色の赤、緑、青成分の強度値を指定する 3 要素の行ベクトルです。強度値は
[0,1]の範囲でなければなりません。たとえば[0.4 0.6 0.7]のようになります。16 進数カラー コードは、ハッシュ記号 (
#) で始まり、3 桁または 6 桁の0からFまでの範囲の 16 進数が続く string スカラーまたは文字ベクトルです。これらの値では大文字小文字は区別されません。したがって、カラー コード"#FF8800"、"#ff8800"、"#F80"、および"#f80"は等価です。
あるいは、名前を使用して一部の一般的な色を指定できます。次の表に、名前の付いた色オプション、等価の RGB 3 成分、および 16 進数カラー コードを示します。
| 色名 | 省略名 | RGB 3 成分 | 16 進数カラー コード | 外観 |
|---|---|---|---|---|
"red" | "r" | [1 0 0] | "#FF0000" |
|
"green" | "g" | [0 1 0] | "#00FF00" |
|
"blue" | "b" | [0 0 1] | "#0000FF" |
|
"cyan" | "c" | [0 1 1] | "#00FFFF" |
|
"magenta" | "m" | [1 0 1] | "#FF00FF" |
|
"yellow" | "y" | [1 1 0] | "#FFFF00" |
|
"black" | "k" | [0 0 0] | "#000000" |
|
"white" | "w" | [1 1 1] | "#FFFFFF" |
|
"none" | 該当なし | 該当なし | 該当なし | 色なし |


次の表に、プロット用のライト テーマとダーク テーマの既定のカラー パレットを示します。
| パレット | パレットの色 |
|---|---|
R2025a より前: ほとんどのプロットで、これらの色が既定で使用されます。 |
|
|
|


orderedcolors 関数と rgb2hex 関数を使用すると、これらのパレットの RGB 3 成分および 16 進数カラー コードを取得できます。たとえば、"gem" パレットの RGB 3 成分を取得し、16 進数カラー コードに変換します。
RGB = orderedcolors("gem");
H = rgb2hex(RGB);
R2023b より前: RGB = get(groot,"FactoryAxesColorOrder") を使用して、RGB 3 成分を取得します。
R2024a より前: H = compose("#%02X%02X%02X",round(RGB*255)) を使用して、16 進数カラー コードを取得します。
例: 'blue'
例: [0 0 1]
例: '#0000FF'
ビュー コンターの可視モード。次のいずれかの値として指定します。
'inherit'— グラフィックの表示設定が親のものと一致する'manual'— グラフィックの表示は継承されず、親の表示とは独立しています。
例
開始時刻が 2021 年 6 月 15 日午前 8 時 55 分 UTC、終了時刻が 5 日後の衛星シナリオを作成します。シミュレーションのサンプル時間を 60 秒に設定します。
startTime = datetime(2021,6,21,8,55,0);
stopTime = startTime + days(5);
sampleTime = 60;                                      % seconds
sc = satelliteScenario(startTime,stopTime,sampleTime)
sc =
satelliteScenario with properties:
StartTime: 21-Jun-2021 08:55:00
StopTime: 26-Jun-2021 08:55:00
SampleTime: 60
AutoSimulate: 1
Satellites: [1×0 matlabshared.satellitescenario.Satellite]
GroundStations: [1×0 matlabshared.satellitescenario.GroundStation]
Platforms: [1×0 matlabshared.satellitescenario.Platform]
Viewers: [0×0 matlabshared.satellitescenario.Viewer]
AutoShow: 1
ケプラーの軌道要素を使用して、シナリオに衛星を追加します。
semiMajorAxis = 7878137;                                                                    % meters
eccentricity = 0;
inclination = 50;                                                                           % degrees
rightAscensionOfAscendingNode = 0;                                                          % degrees
argumentOfPeriapsis = 0;                                                                    % degrees
trueAnomaly = 50;                                                                           % degrees
sat = satellite(sc,semiMajorAxis,eccentricity,inclination,rightAscensionOfAscendingNode, ...
    argumentOfPeriapsis,trueAnomaly)
sat =
  Satellite with properties:

                  Name:  Satellite 1
                    ID:  1
        ConicalSensors:  [1x0 matlabshared.satellitescenario.ConicalSensor]
               Gimbals:  [1x0 matlabshared.satellitescenario.Gimbal]
          Transmitters:  [1x0 satcom.satellitescenario.Transmitter]
             Receivers:  [1x0 satcom.satellitescenario.Receiver]
              Accesses:  [1x0 matlabshared.satellitescenario.Access]
               Eclipse:  [1x0 Aero.satellitescenario.Eclipse]
           GroundTrack:  [1x1 matlabshared.satellitescenario.GroundTrack]
                 Orbit:  [1x1 matlabshared.satellitescenario.Orbit]
        CoordinateAxes:  [1x1 matlabshared.satellitescenario.CoordinateAxes]
       OrbitPropagator:  sgp4
           MarkerColor:  [0.059 1 1]
            MarkerSize:  6
             ShowLabel:  true
        LabelFontColor:  [1 1 1]
         LabelFontSize:  15
         Visual3DModel:
    Visual3DModelScale:  1
撮影する場所を表す地上局をシナリオに追加します。
gs = groundStation(sc,Name="Location to Photograph", ...
    Latitude=42.3001,Longitude=-71.3504)                 % degrees
gs =
  GroundStation with properties:

                 Name:  Location to Photograph
                   ID:  2
             Latitude:  42.3001 degrees
            Longitude:  -71.3504 degrees
             Altitude:  0 meters
    MinElevationAngle:  0 degrees
       ConicalSensors:  [1x0 matlabshared.satellitescenario.ConicalSensor]
              Gimbals:  [1x0 matlabshared.satellitescenario.Gimbal]
         Transmitters:  [1x0 satcom.satellitescenario.Transmitter]
            Receivers:  [1x0 satcom.satellitescenario.Receiver]
             Accesses:  [1x0 matlabshared.satellitescenario.Access]
              Eclipse:  [1x0 Aero.satellitescenario.Eclipse]
       CoordinateAxes:  [1x1 matlabshared.satellitescenario.CoordinateAxes]
          MarkerColor:  [1 0.4118 0.1608]
           MarkerSize:  6
            ShowLabel:  true
       LabelFontColor:  [1 1 1]
        LabelFontSize:  15
衛星にジンバルを追加します。このジンバルは衛星とは独立して操縦できます。
g = gimbal(sat)
g =
  Gimbal with properties:

                Name:  Gimbal 3
                  ID:  3
    MountingLocation:  [0; 0; 0] meters
      MountingAngles:  [0; 0; 0] degrees
      ConicalSensors:  [1x0 matlabshared.satellitescenario.ConicalSensor]
        Transmitters:  [1x0 satcom.satellitescenario.Transmitter]
           Receivers:  [1x0 satcom.satellitescenario.Receiver]
      CoordinateAxes:  [1x1 matlabshared.satellitescenario.CoordinateAxes]
ジンバルを使用して撮影する場所を追跡します。
pointAt(g,gs);
ジンバルにコニカル センサーを追加します。このセンサーはカメラを表します。視野を60度に設定します。
camSensor = conicalSensor(g,MaxViewAngle=60)
camSensor =
  ConicalSensor with properties:

                Name:  Conical sensor 4
                  ID:  4
    MountingLocation:  [0; 0; 0] meters
      MountingAngles:  [0; 0; 0] degrees
        MaxViewAngle:  60 degrees
            Accesses:  [1x0 matlabshared.satellitescenario.Access]
         FieldOfView:  [0x0 matlabshared.satellitescenario.FieldOfView]
      CoordinateAxes:  [1x1 matlabshared.satellitescenario.CoordinateAxes]
カメラと撮影場所の間にあるコニカル センサーにアクセス解析を追加します。
ac = access(camSensor,gs)
ac =
  Access with properties:

    Sequence:  [4 2]
    LineWidth:  3
    LineColor:  [0.3922 0.8314 0.0745]
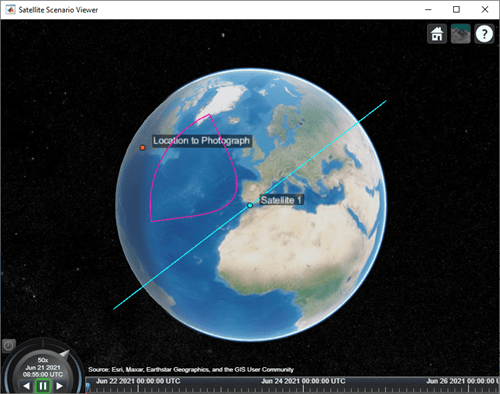
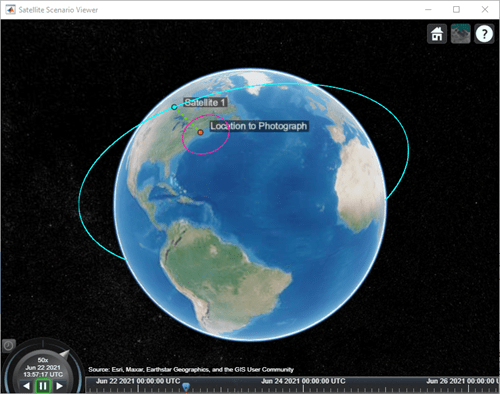
衛星シナリオ ビューアーを使用して、カメラの視野を可視化します。
v = satelliteScenarioViewer(sc);
fieldOfView(camSensor);
カメラが地理的サイトを視認できる間隔を決定します。
t = accessIntervals(ac)
t=35×8 table
          Source                   Target             IntervalNumber         StartTime                EndTime           Duration    StartOrbit    EndOrbit
    __________________    ________________________    ______________    ____________________    ____________________    ________    __________    ________

    "Conical sensor 4"    "Location to Photograph"           1          21-Jun-2021 10:38:00    21-Jun-2021 10:55:00      1020           1            2
    "Conical sensor 4"    "Location to Photograph"           2          21-Jun-2021 12:36:00    21-Jun-2021 12:58:00      1320           2            3
    "Conical sensor 4"    "Location to Photograph"           3          21-Jun-2021 14:37:00    21-Jun-2021 15:01:00      1440           3            4
    "Conical sensor 4"    "Location to Photograph"           4          21-Jun-2021 16:41:00    21-Jun-2021 17:04:00      1380           5            5
    "Conical sensor 4"    "Location to Photograph"           5          21-Jun-2021 18:44:00    21-Jun-2021 19:07:00      1380           6            6
    "Conical sensor 4"    "Location to Photograph"           6          21-Jun-2021 20:46:00    21-Jun-2021 21:08:00      1320           7            7
    "Conical sensor 4"    "Location to Photograph"           7          21-Jun-2021 22:50:00    21-Jun-2021 23:04:00       840           8            8
    "Conical sensor 4"    "Location to Photograph"           8          22-Jun-2021 09:51:00    22-Jun-2021 10:02:00       660          13           13
    "Conical sensor 4"    "Location to Photograph"           9          22-Jun-2021 11:46:00    22-Jun-2021 12:07:00      1260          14           15
    "Conical sensor 4"    "Location to Photograph"          10          22-Jun-2021 13:46:00    22-Jun-2021 14:10:00      1440          15           16
    "Conical sensor 4"    "Location to Photograph"          11          22-Jun-2021 15:49:00    22-Jun-2021 16:13:00      1440          16           17
    "Conical sensor 4"    "Location to Photograph"          12          22-Jun-2021 17:53:00    22-Jun-2021 18:16:00      1380          18           18
    "Conical sensor 4"    "Location to Photograph"          13          22-Jun-2021 19:55:00    22-Jun-2021 20:18:00      1380          19           19
    "Conical sensor 4"    "Location to Photograph"          14          22-Jun-2021 21:58:00    22-Jun-2021 22:16:00      1080          20           20
    "Conical sensor 4"    "Location to Photograph"          15          23-Jun-2021 10:56:00    23-Jun-2021 11:16:00      1200          26           27
    "Conical sensor 4"    "Location to Photograph"          16          23-Jun-2021 12:56:00    23-Jun-2021 13:19:00      1380          27           28
      ⋮
最大再訪問時間を時間単位で計算します。
startTimes = t.StartTime;
endTimes = t.EndTime;
revisitTimes = hours(startTimes(2:end) - endTimes(1:end-1));
maxRevisitTime = max(revisitTimes)                             % hours
maxRevisitTime = 12.666666666666666
カメラがその場所を撮影した再訪問時間を可視化します。
play(sc);
バージョン履歴
R2021a で導入