Run PIL Simulation with TI mmWave Radar Board
Radar Toolbox Support Package for Texas Instruments mmWave Radar Sensors allows you to configure a Simulink model to run Processor-in-the-Loop (PIL). The PIL verification process is a crucial part of the development cycle to ensure that the behavior of the deployment code matches the design. In a PIL simulation, the generated code runs on the ARM Cortex core of TI mmWave radar board.
The results of the PIL simulation are transferred to Simulink to verify the numerical equivalence of the simulation and the code generation results. You can perform execution time profiling using tools like Code Profile Analyzer to verify that your generated code will perform correctly and efficiently on the actual target hardware.
You can perform either block-level simulation or top model simulation.
Block-Level Simulation
If you are adopting block-level simulation using PIL, the control algorithm is defined using a referenced model.
Create a Simulink model with the control logic represented in a referenced model. For example, consider this model that contains a referenced model named
ControlBlk.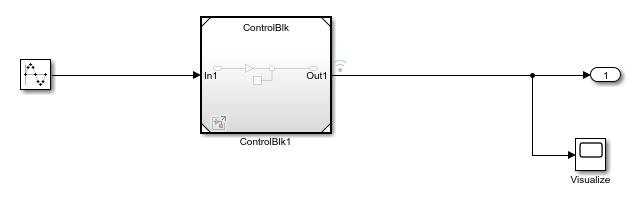
For more information about referenced model and Model block, see Model (Simulink).
Specify the hardware:
In the Simulink model and press Ctrl + E to open the Configuration Parameters.
Set the Hardware Board parameter to one of the supported TI mmWave radar boards that you plan to connect the host computer to perform the PIL simulation.

Click Apply and OK.
Select the referenced model, and on the Model Block tab, set Simulation Mode to
Processor-in-the-loop (PIL).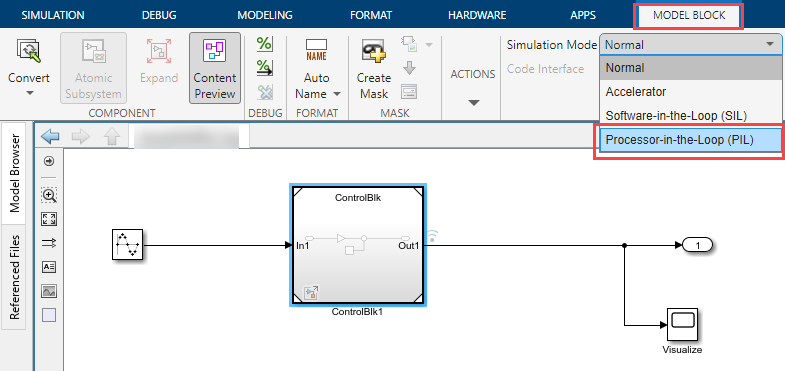
On the Apps tab, under Code Verification, Validation, and Test, click SIL/PIL Manager.
On the SIL/PIL tab, set System Under Test to
Model blocks in SIL/PIL
                     mode
. With this setting, the ControlBlk model block is configured for PIL operation, and code will be generated for only that referenced model block and then deployed to the processor on the hardware board.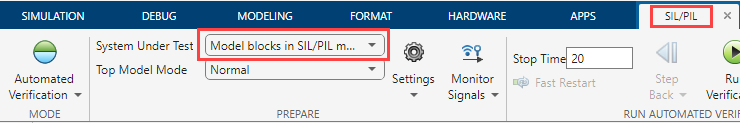
Set the Mode in SIL/PIL tab according to the controller model to be deployed:
If the controller model (model block) contains the Read Detections block from Radar Toolbox Support Package for Texas Instruments mmWave Radar Sensors, select
SIL/PIL Simulation Only. TheAutomated Verificationoption does not work in this case because the block does not support simulation.If the controller model (model block) does not contain the Read Detections block (that is, the model uses point cloud data obtained from other sources), select
Automated
                           Verification
. With this setting, the app will run two simulations back-to-back (model simulation in normal, accelerator, or rapid accelerator mode, and then the processor-in-the-loop (PIL) simulation).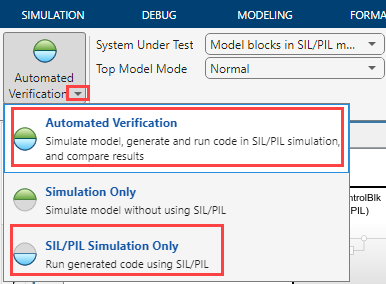
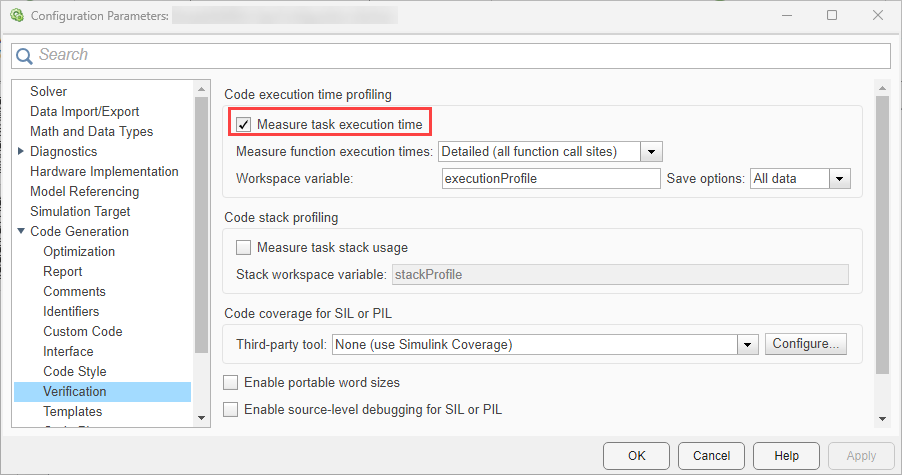
Optionally, generate a PIL task profiling report. On the SIL/PIL tab, expand Settings and enable Task Profiling. Enabling this option measures the task execution time.
If required, configure the simulation to produce execution-time metrics for tasks and functions in your generated code (see Create Execution-Time Profile for Generated Code (Embedded Coder)).
In the Stop Time field, specify the simulation time. For the Automated Verification mode, you cannot specify
inf.Open Configuration Parameters (press Ctrl + E), and select Measure task execution time. Click Apply and OK to close the Configuration Parameters.
On the SIL/PIL tab in Simulink, click either Run Verification or Run SIL/PIL according to the Mode that you selected.
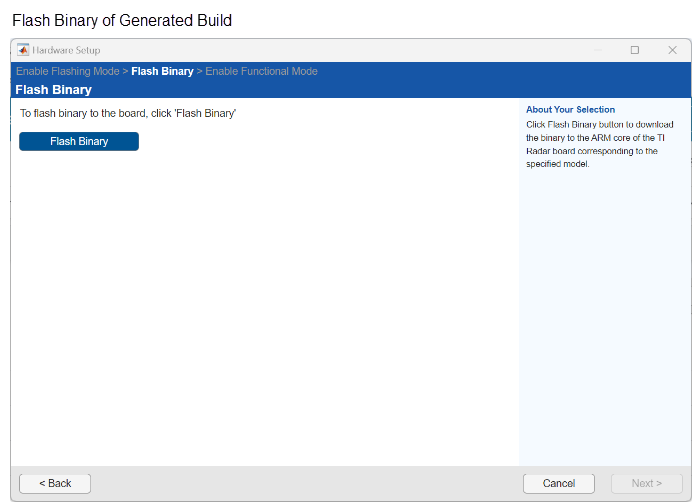
After the executable is created, the Simulink window becomes non-interactive and the Hardware Setup windows appear instead, which provide the step-by-step instructions to set the flashing mode of TI mmWave radar board, flash the binary of the generated build, and then return to functional mode. This process also involves changing the switch positions on the board, as described in the instructions. After completing each step, click Next on the window to proceed.
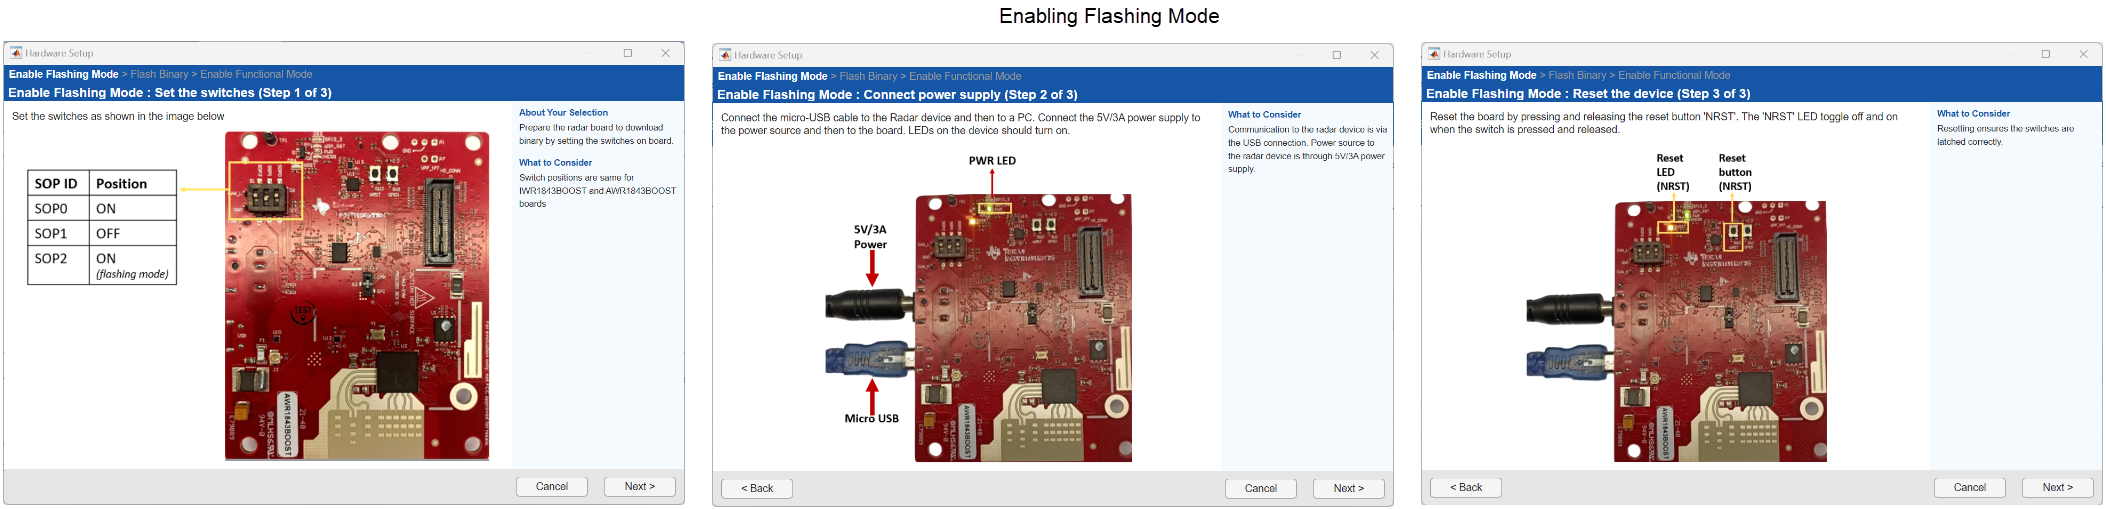
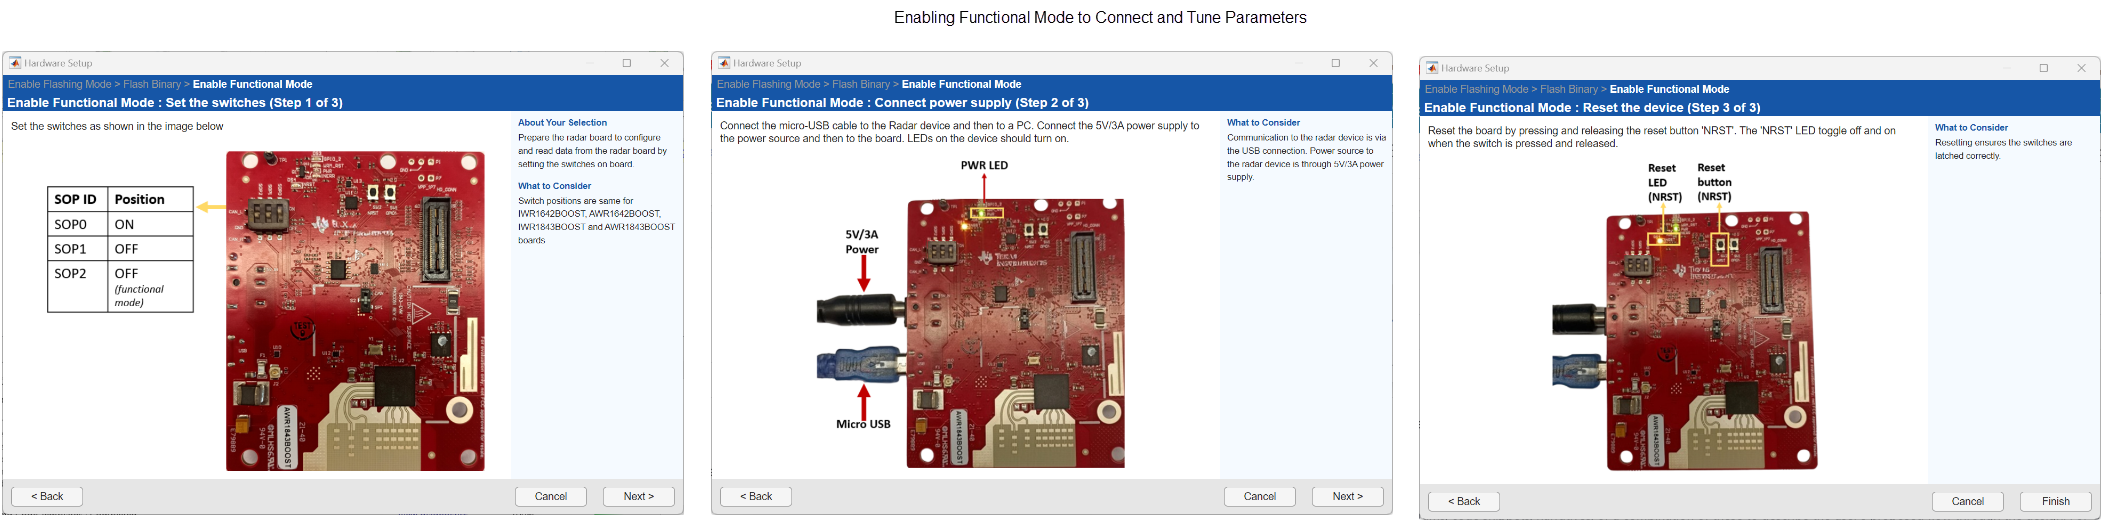
After you click Finish at the last step, the PIL simulation is resumed.
At the end of the simulation, in the Results section, click Data Inspector to view simulation results.
Top-Level Simulation
In the top-level PIL simulation, code is generated for the top-level reference model and then deployed and executed on the connected hardware board. For detailed instructions on configuring a top-level PIL simulation, see Configure and Run PIL Simulation (Embedded Coder).
When using a top-level PIL simulation on models that are configured using Radar Toolbox Support Package for Texas Instruments mmWave Radar Sensors, the top-level reference model executes on the ARM Cortex processor in the TI mmWave radar board.
To configure and run a top-model PIL simulation:
On the Apps tab, click SIL/PIL Manager.
In the Mode section, select SIL/PIL Simulation Only.
In the Prepare section, set System Under Test to
Top model.In the SIL/PIL Mode field, select
Processor-in-the-Loop (PIL).Set the Mode in SIL/PIL tab to
SIL/PIL Simulation Only.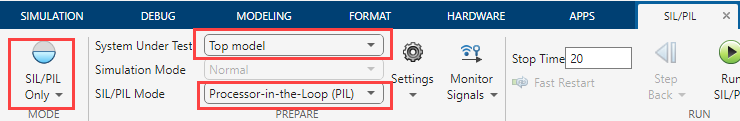
To monitor component signals and state data and compare values from the model and SIL or PIL simulations, use the options under Monitor Signals.
If required, configure the simulation to produce execution-time metrics for tasks and functions in your generated code (see Create Execution-Time Profile for Generated Code (Embedded Coder)).
In the Run section, in the Stop Time field, specify simulation time.
Click Run SIL/PIL.
The PIL simulation starts and you need to complete the steps for Hardware Setup as well (as described in Step 12 of Block-Level Simulation).
At the end of the simulation, in the Results section, click Data Inspector to view simulation results.
Analyze Execution-time and Stack Usage Profiles for Generated Code
PIL simulation produces execution-time metrics for your generated code. During the simulation, you can use the Simulation Data Inspector to observe streamed execution times.
You can also use Code Profile Analyzer to analyze task and function execution times. To open the Code Profile Analyzer:
Click the SIL/PIL tab.
In the Results gallery, under Execution Profiling Results, click Code Profile Analyzer.
In the Task Execution panel of Code Profile Analyzer, the Task Execution Times view shows execution-time metrics for the generated code sections.
The CPU Utilization view in Code Profile Analyzer provides information about the CPU workload, which enables you to determine whether you can run the generated code on the TI mmWave radar board.
Note
If the controller model used in PIL simulation includes the Read Detections block, the Code Profile Analyzer does not display CPU Utilization. This is because the ARM Cortex core of the TI mmWave radar board runs multiple CPU threads that are not periodic, but essential to functioning of the board, in addition to the MATLAB generated code. Due to these aperiodic threads, CPU utilization metric may produce inaccurate results; therefore, the CPU Utilization view is disabled.