Getting Started with Deploying Applications to the ARM Cortex Core of Texas Instruments mmWave Radars
This example demonstrates how to use the Radar Toolbox Support Package for Texas Instruments® mmWave Radar Sensors to deploy a Simulink® model on the ARM® Cortex® core of a Texas Instruments mmWave Radar board.
Using this example, you will learn how to:
Model applications that use detection (point cloud) data acquired from the TI Radar sensor.
Use External Mode (Monitor and Tune) to adjust parameters and observe the behavior of a Simulink model running on the TI Radar hardware in real time.
Build and deploy the Simulink model to the ARM Cortex core of the TI Radar board.
Required MathWorks Products
MATLAB®
Simulink®
Embedded Coder®
Radar Toolbox®
Radar Toolbox Support Package for Texas Instruments® mmWave Radar Sensors
For details about installing the support package, see Install Support and Perform Hardware Setup for TI mmWave Hardware
Prerequisites for Modeling, Building, and Deploying Applications
To model, build, and deploy applications using the Radar Toolbox Support Package for Texas Instruments® mmWave Radar Sensors, you must install additional third-party software. The hardware setup process guides you through these installation steps.
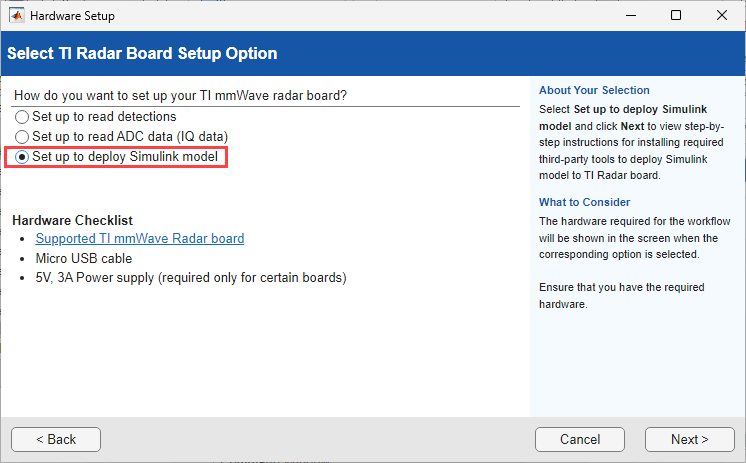
To begin hardware setup, enter the following command in the MATLAB® Command Window:
mmWaveRadarSetup
On the second screen of the hardware setup interface, select Setup to deploy Simulink model, then click Next. Follow the on-screen instructions to download and install all required third-party tools.
Required Hardware
One of the supported TI mmWave Radar Evaluation Modules (EVM) (see Supported Boards)
USB Cable Type A to Micro B
Additional power adapter (if you are using the AWR1642BOOST, IWR1642BOOST, AWR1843BOOST or IWR1843BOOST boards)
Connect the TI Radar board to micro USB cable and power cable (if applicable).
Create and Configure the Model
A pre-configured model for the TI IWR6843ISK hardware is provided with this example. If you are using a different TI mmWave Radar board, update the Hardware board setting as described in Configure a New Model for TI mmWave Radar.
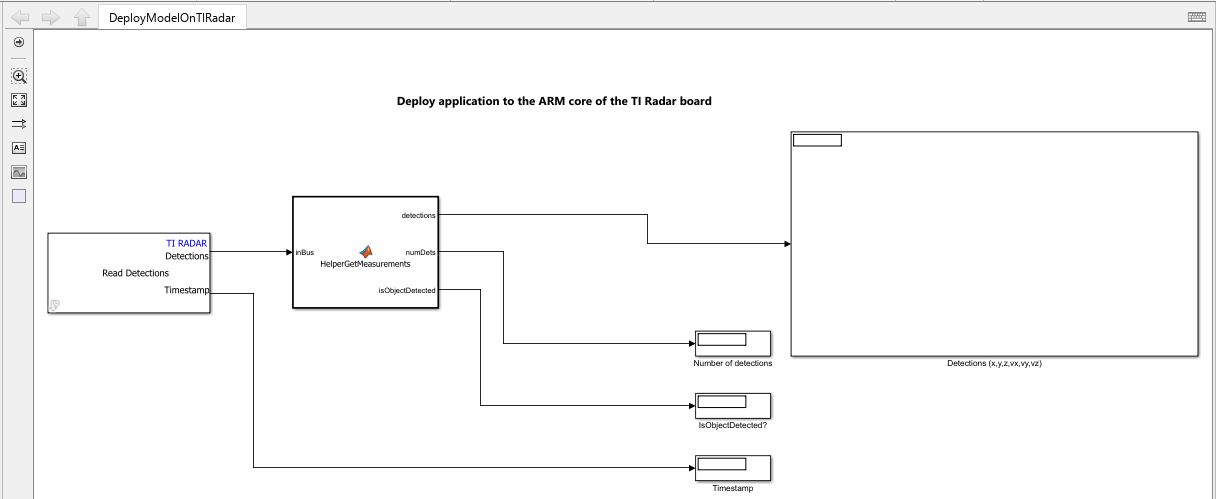
Open the pre-configured DeployModelOnTIRadar model.
modelName = "DeployModelOnTIRadar";
open_system(modelName);
This model consists of two key blocks:
Read Detections: The Read Detections block reads radar detections using Texas Instruments® mmWave radar sensors. Use this block to obtain the number of detections and the detection data as a Simulink bus at the output. You can specify the configuration file (.cfg) specific to the TI mmWave radar board to obtain the detection data. To generate config file, refer to Configure Radar Using a Configuration (.cfg) File for Reading Detections.
HelperGetMeasurements: This MATLAB Function block converts the Read Detections block's output (a Simulink bus with a MATLAB structure) into a measurement matrix containing position (x, y, z) and velocity (vx, vy, vz) values, along with the valid number of detections (numDets) and a flag to identify if an object is detected or not. If the maximum number of detections (n) is set in the Read Detections block, the output will be an n-by-6 matrix. Only the first m rows (where m is numDets) contain valid data. Double click the block to view the implementation details.
In this example, display blocks are used to visualize the data read from the hardware, but you can also use other visualization tools, such as scopes or the Simulink Data Inspector, to view the data.
Run Simulink Model in External Mode (Monitor & Tune)
External mode enables you to monitor signals and tune parameters in real time while the application (the executable generated from your model) is running on the TI mmWave Radar hardware.
For more information on external mode, see Signal Monitoring and Parameter Tuning of Model Running on TI mmWave Radar Board and Perform Monitor and Tune for Data Logging and Real-Time Execution.
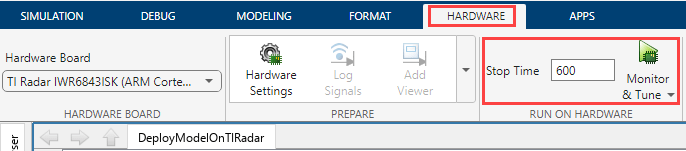
To run the model in external mode:
1. On the Hardware tab of the Simulink model, set the Stop Time according to your requirements. To run the model indefinitely, enter inf as the stop time.
2. Click Monitor & Tune.
The status of the build, deployment, and execution process is displayed in the lower left corner of the Simulink model window as Simulink prepares, downloads, and runs the model on the hardware.
After the build process completes, hardware setup screens appear. These screens will guide you through the following steps:
Switching the TI Radar device to flashing mode, which is required before deploying the code.
Deploying the generated code to the device.
Setting the device to functional mode, which is necessary to execute the code on the hardware.
Once you have completed these steps as prompted by the hardware setup screens, the code generated from your model will begin running on the TI Radar device.
Note: Ensure that you click Finish on the hardware setup screens only after you have made the necessary switch settings and performed a reset.
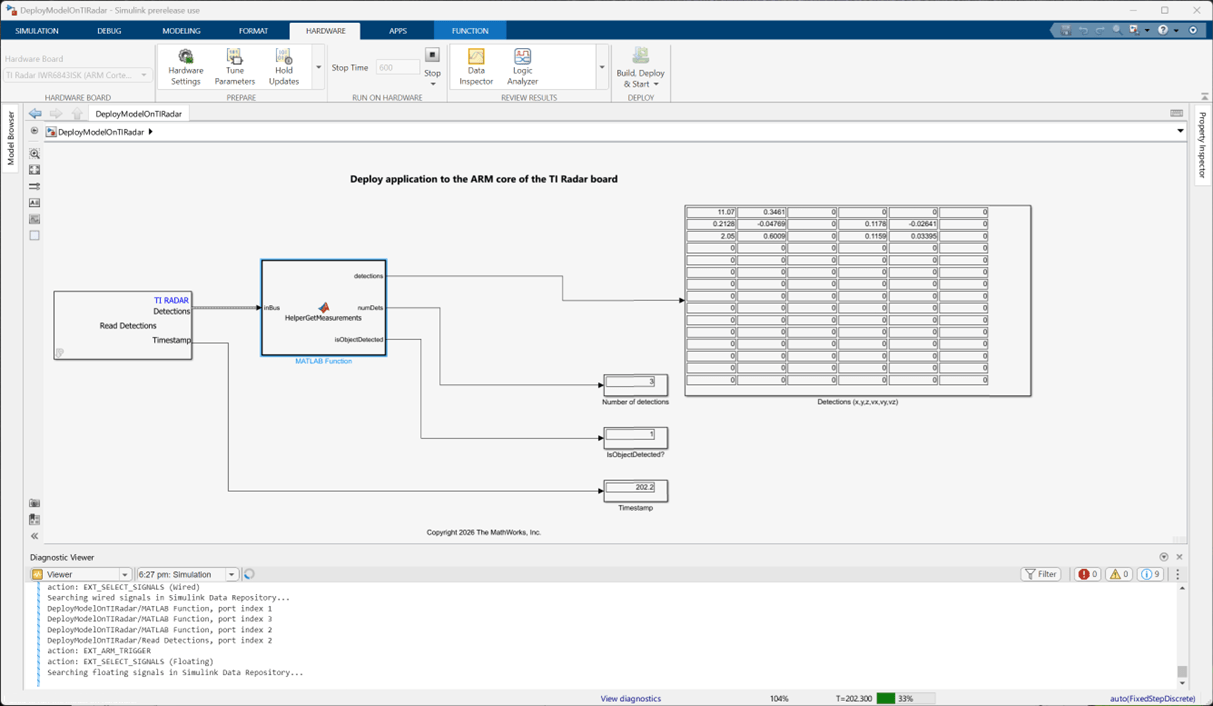
While the model is executing in external mode, you can monitor the position and velocity data from the TI Radar, as well as the object detection status, in real-time.
Parameter Tuning in External Mode
You can tune parameters during execution in external mode. For example, the Read Detections block contains parameters that can be adjusted while the model is running:
To view and modify tunable parameters in Read Detections block, double-click the Read Detections block to open its block mask.
Navigate to the Detection reporting tab and adjust the desired settings during external mode execution (the parameters that cannot be tuned during run time are disabled).
For example, you can toggle the Remove Static Clutter parameter in the Read Detections block to see its effect in real time while the model is running on the hardware. When this parameter is enabled, detections related to static objects will not be reported and vice versa.
Deploy a Simulink Model to TI mmWave Radar Hardware and Transmit Data via Serial Port
This section guides you through the steps to deploy a Simulink model to TI mmWave Radar board and transmit application data over the serial interface. The example includes another model that includes blocks for data serialization and UART transmission.
Open the pre-configured Model for deployment workflow.
modelName = "DeployModelOnTIRadarWithSerialTransmit";
open_system(modelName);
The model is set up for the TI IWR6843ISK board. If you are using a different hardware, change the Hardware Board setting as described in Configure a New Model for TI mmWave Radar.
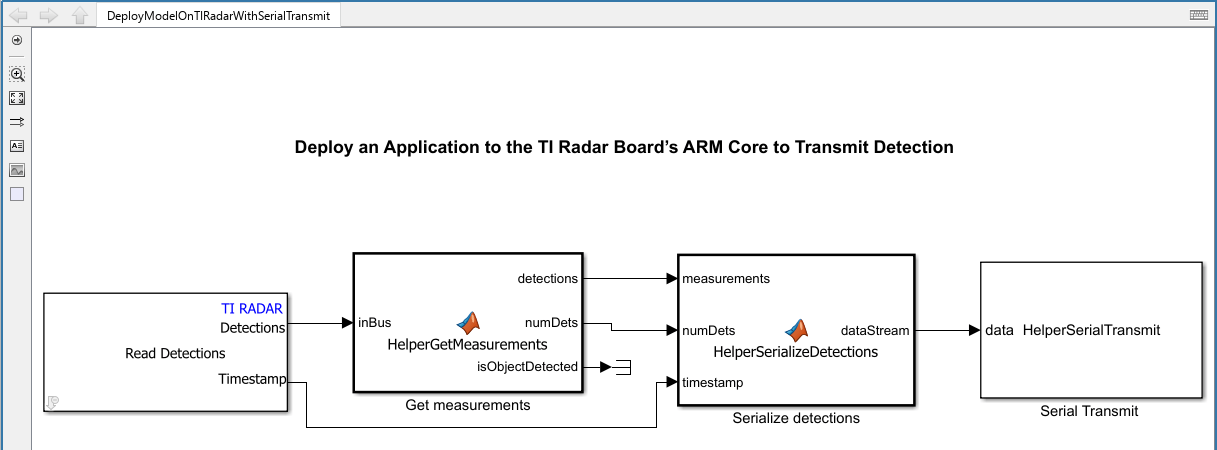
This model consists of four key blocks:
Read Detections: The Read Detections block reads radar detections using Texas Instruments® mmWave radar sensors. Use this block to obtain the number of detections and the detection data as a Simulink bus at the output. You can specify the configuration file (.cfg) specific to the TI mmWave radar board to obtain the detection data. To generate config file, refer to Configure Radar Using a Configuration (.cfg) File for Reading Detections.
HelperGetMeasurements: This MATLAB Function block converts the Read Detections block's output (a Simulink bus with a MATLAB structure) into a measurement matrix containing position (x, y, z) and velocity (vx, vy, vz) values, along with the valid number of detections (numDets) and a flag to identify if an object is detected or not. If the maximum number of detections (n) is set in the Read Detections block, the output will be an n-by-6 matrix. Only the first m rows (where m is numDets) contain valid data. Double click the block to view the implementation details.
HelperSerializeDetections: This MATLAB Function block serializes the measurements, timestamp, and valid detection count into a data packet. Each packet follows the below format.
header ('&', 1 byte) | timestamp (4 bytes, single) | numDets (4 bytes, uint32) | [x, y, z, vx, vy, vz] (6 singles per detection)
Only the data corresponding to numDets is valid in the packet; rest of the packet will be appended with zeros. This is done to avoid variable-sized allocation.
HelperSerialTransmit: This MATLAB System block transmits the serialized data over the TI Radar's serial channel (Serial port 1, which corresponds to SCI-B module – Data port). The transmitted data can be received via a USB connection on your host PC. To identify the correct data port, see Identifying Serial Ports for TI mmWave Radar Connection. Any standard serial terminal can receive the data. In this example, a MATLAB script is used to read, decode, and plot detections with timestamps and a valid number of detections. The baud rate is set in the block mask (default: 921600).
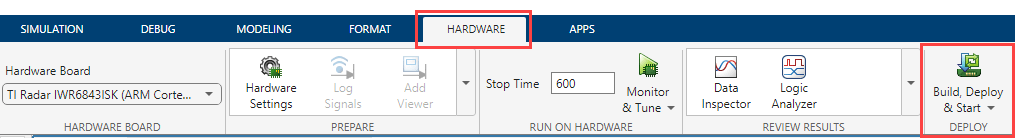
Build and Deploy the Model
To build and deploy the model as a standalone executable, click Build and Deploy on the Hardware tab.
After the build process is completed, follow the on-screen prompts to:
Set the device to flashing mode (required for code deployment)
Deploy the code
Switch the device to functional mode (to run the deployed code on hardware)
Follow the steps as mentioned in the screen to run the code on the hardware.
Data Acquisition and Visualization in MATLAB
You can use any serial terminal to view the output byte stream from the standalone application that you deployed. For visualization, use the MATLAB script decodeAndPlotDetections.m provided with the example. This script reads the serial data, deserializes it, and extracts the x and y coordinates, number of detections, and timestamps. The script then displays this information in MATLAB for analysis.
To open the script in MATLAB, execute:
open('decodeAndPlotDetections.m');
Note: Before running the decodeAndPlotDetections.m script, ensure to:
Adjust the
dataportparameter in thedecodeAndPlotDetections.mscript to match the host computer's data port. For details, refer to Identifying Serial Ports for TI mmWave Radar Connection.If you change the Maximum number of detections in the Read Detection block, update the
maxNumDetsparameter in the script accordingly.If you modify the baud rate in the HelperSerialTransmit block, update the
baudRateparameter in the script as well.
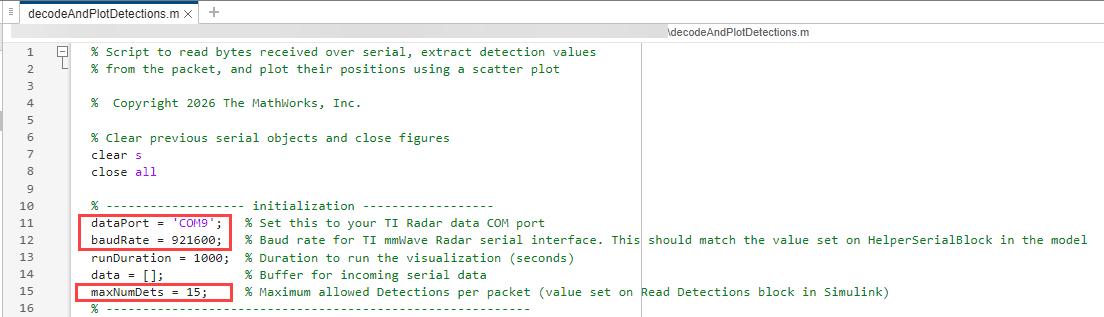
The decodeAndPlotDetections.m script connects to a TI mmWave Radar board through a specified serial port and continuously reads detection data packets transmitted from the radar hardware. The received byte stream is buffered and deserialized to extract object positions, timestamps, and the number of detections in each packet. The script then visualizes these detections in real time using a scatter plot in MATLAB, updating the plot and annotation with each new packet received. The key parameters such as the serial port, baud rate, run duration, and maximum number of detections can be configured at the beginning of the script. The script requires the helper functions HelperInitializePlot.m and HelperDeserializeDetections.m to run properly.
The HelperInitializePlot function creates and configures a scatter plot in a new MATLAB figure, specifically designed for visualizing object positions detected by a radar system. The function sets up the plot with appropriate axis limits, grid lines, and customized colors to enhance readability. It also initializes a scatter plot handle for plotting detection points and adds a text annotation to display information such as the current timestamp and the number of detections. Both the scatter plot and annotation handles are returned so that they can be updated dynamically during real-time data acquisition and visualization.
The HelperDeserializeDetections function processes a stream of raw byte data received from a TI mmWave Radar over a serial connection. It searches the incoming data stream for a valid detection packet, identified by a specific header byte. Once a packet is found, the function extracts key information including the timestamp, the number of detections, and the measurement data for each detected object (position and velocity components).. The decoded information is returned as a structured output, while any unused or incomplete bytes are returned as leftover for processing in the next function call.
This figure shows an example of the visualization of object detection when you run decodeAndPlotDetections.m, after the deployment workflow is completed and when the standalone application runs on the TI mmWave Radar board.