FMCW Radar Altimeter Simulation
This example shows how to model a radar altimeter and measure the performance by simulating two scenarios using a land surface and moving platform. You will see how to build a waveform level altimeter model using a radarTransceiver and custom signal processor class. You will also see how to build a radarScenario by generating a LandSurface from an imported elevation data file and a Platform with an imported flight trajectory. Finally, you will see how to simulate the radar scenario to measure the performance of the radar altimeter.
Radar Parameter Definition
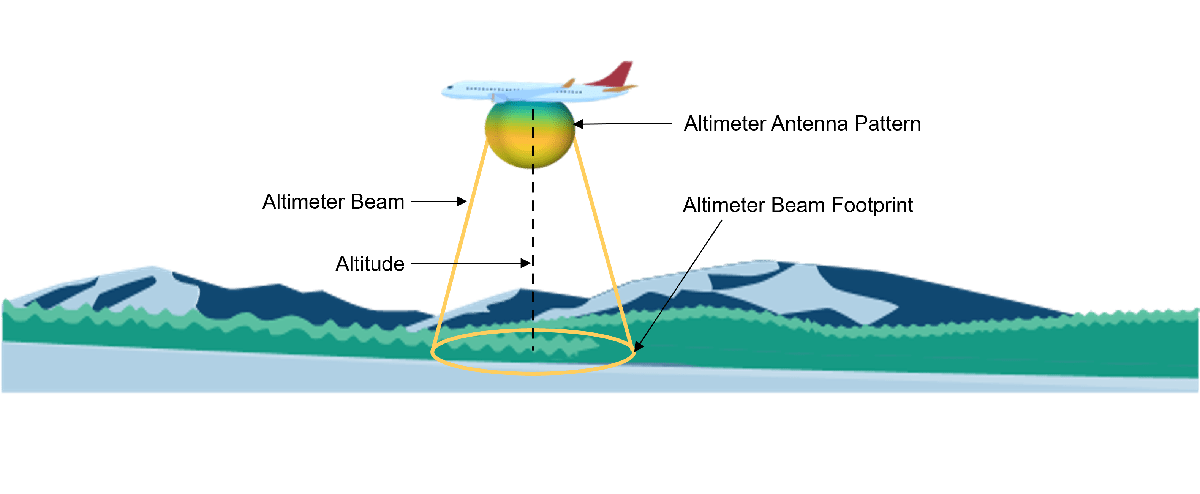
Aircraft have radar altimeters to determine the altitude above the local terrain as depicted in the figure below. Radar altimeters typically operate at 4.3 GHz and employ either FMCW or pulsed waveforms. These radars typically have very wide beamwidths (40 - 60 degrees) to provide accurate altitude estimates as the aircraft pitch and roll angles fluctuate throughout the flight.
The altimeter model uses parameters from the first altimeter described in Table 2 of the Radar Altimeter Recommendation ITU Document [1].
fCenter = 4.3e9;           % Center frequency (Hz)
bandwidth = 150e6;         % Bandwidth (Hz)
prf = 143;                 % Pulse repetition frequency (Hz)
antBeamwidth = 40;         % Beamwidth (degrees)
pTransmitter = 0.4;        % Transmitter power (W)
rMax = 1676;               % Highest altitude required (m)
sweepDir = 'Triangle';     % Sweep direction of the FMCW waveform
noiseFigure = 8;           % Receiver noise figure (dB)
Creating the Radar Altimeter Model
The radar altimeter model consists of two components. The first component is a radarTransceiver. This component models the transmission of the waveform and reception of the ground echo at the altimeter. The second component is a custom component created for this example. This component takes the IQ samples generated by the radarTransceiver and performs the signal processing necessary to calculate the altitude.
Antenna Design
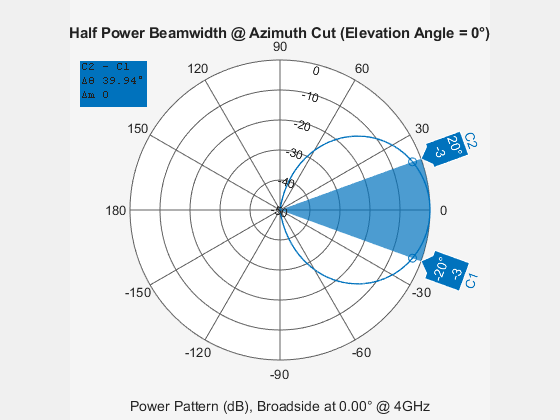
A phased.GaussianAntennaElement is used to model the altimeter antenna element. The idealized antenna pattern of this antenna element has no sidelobes but will suffice for the purposes of this simulation.
% Generate the Gaussian antenna element
frequencyRange = [fCenter-bandwidth/2 fCenter+bandwidth/2];
altimeterAntennaElement = phased.GaussianAntennaElement('Beamwidth',antBeamwidth,'FrequencyRange',frequencyRange);

% Plot the beamwidth to verify that it matches the expected antenna beamwidth
beamwidth(altimeterAntennaElement,fCenter);
The transmit and receive antennas are modeled as a phased.Radiator and phased.Collector. Each antenna contains the phased.GaussianAntennaElement.
altimeterTxAntenna = phased.Radiator('OperatingFrequency',fCenter,'Sensor',altimeterAntennaElement, 'SensorGainMeasure','dBi');
altimeterRxAntenna = phased.Collector('OperatingFrequency',fCenter,'Sensor',altimeterAntennaElement,'SensorGainMeasure','dBi');
Waveform Design
Altimeters commonly use FMCW technology for many reasons, including the ability to measure short distances, high range accuracy, and low power requirements as discussed in [1]. Therefore, this example uses a triangle FMCW waveform.
A key processing step for FMCW radar is dechirping. Dechirping is the process of mixing the transmitted waveform with the received signal. For dechirping to work properly in simulation, the sampling frequency of the waveform must be at least the signal bandwidth. The simulation differs from the real world in this regard, because in a real receiver, dechirping occurs in the analog domain. The A/D sampling rate in an FMCW receiver only needs to be high enough to capture the bandwidth of the dechirped signal, which is much lower than the signal bandwidth.
Therefore, two sampling rates are used for the purpose of this simulation. The first sampling rate called the waveformSamplingRate is based on the waveform bandwidth and is used to generate the IQ and dechirp the signal. The second sampling rate called the receiverSamplingRate is based on the maximum expected beat frequency in the dechirped signal. After dechirping, the signal is down-sampled to the receiverSamplingRate to perform the remainder of the signal processing tasks.
To generate the waveform, first calculate the sweep slope and set the waveformSamplingRate, which is based on the bandwidth. The sampling rate of the waveform is not exactly the bandwidth, because the waveform sampling rate times the sweep time must be an integer for the simulation to work properly.
tSweep = 1/(2*prf);                                        % Sweep time (s) is half of the sweep period because this is a two sided FMCW waveform
nSweep = 2;                                                % There are two sweeps in one processing interval, 1 upsweep, 1 downsweep
sweepSlope = bandwidth/tSweep;                             % Sweep slope (Hz / s)
waveformSamplingRate = round(bandwidth*tSweep)/tSweep;     % Sampling rate of the waveform (Hz)
Create the FMCW waveform once the sweep time and waveform sampling rate have been calculated.
altimeterWaveform = phased.FMCWWaveform('SweepBandwidth',bandwidth,'SampleRate',waveformSamplingRate,'SweepDirection',sweepDir,'SweepTime',tSweep,'OutputFormat','Sweeps');
Create the Radar Transceiver
The radarTransceiver can be fully modeled now that the antenna and waveform have been created.
Create the transmitter and receiver using previously defined system parameters and the selected sampling rate calculated in the previous section.
altimeterTransmitter = phased.Transmitter('PeakPower',pTransmitter);
altimeterReceiver = phased.ReceiverPreamp('SampleRate', waveformSamplingRate,'NoiseFigure', noiseFigure);
Create the radarTransceiver. The mounting angle is set so that the altimeter is facing towards the surface in the North, East, Down (NED) reference frame.
altimeterTransceiver = radarTransceiver('Waveform',altimeterWaveform,...
    'Transmitter',altimeterTransmitter, ...
    'TransmitAntenna',altimeterTxAntenna, ...
    'ReceiveAntenna',altimeterRxAntenna, ...
    'Receiver',altimeterReceiver, ...
    'MountingAngles', [0 -90 0], ...
    'NumRepetitions', nSweep)
altimeterTransceiver =
  radarTransceiver with properties:

                Waveform: [1×1 phased.FMCWWaveform]
             Transmitter: [1×1 phased.Transmitter]
         TransmitAntenna: [1×1 phased.Radiator]
          ReceiveAntenna: [1×1 phased.Collector]
                Receiver: [1×1 phased.ReceiverPreamp]
      MechanicalScanMode: 'None'
      ElectronicScanMode: 'None'
        MountingLocation: [0 0 0]
          MountingAngles: [0 -90 0]
    NumRepetitionsSource: 'Property'
          NumRepetitions: 2
       RangeLimitsSource: 'Property'
             RangeLimits: [0 Inf]
         RangeOutputPort: false
          TimeOutputPort: false
Create the Signal Processor
Collect the upsweep and downsweep waveform samples from the altimeterTransceiver. The signal processor uses these samples to dechirp the received signals.
upsweepWaveformSamples = altimeterTransceiver.Waveform();       % Upsloping signal IQ
downsweepWaveformSamples = altimeterTransceiver.Waveform();     % Downsloping signal IQ
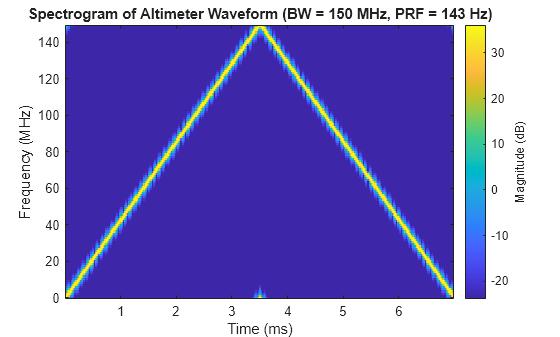
Plot the spectrogram of the waveform to ensure it matches expectations for a triangular FMCW waveform.
figure;
stft([upsweepWaveformSamples;downsweepWaveformSamples],waveformSamplingRate,'FrequencyRange','twosided')
title('Spectrogram of Altimeter Waveform (BW = 150 MHz, PRF = 143 Hz)')
The IQ data is down-sampled to the receiverSamplingRate by the signal processor after dechirping. The receiverSamplingRate must be at least twice the maximum beat frequency. The maximum beat frequency is the sum of the maximum range delay frequency and the maximum Doppler shift frequency. Calculate the maximum beat frequency and receiver sampling rate.
frmax = range2beat(rMax,sweepSlope);     % Maximum frequency (Hz) due to range
vmax = 8;                                % Max rate of descent (m/s)
h = freq2wavelen(fCenter);               % Wavelength (m)
fdmax = 2*speed2dop(vmax,h);             % Maximum frequency shift (Hz) due to radial velocity
fbmax = frmax+fdmax;                     % Maximum beat frequency (Hz)
receiverSamplingRate = 2*fbmax;          % Sampling rate of the receiver (Hz)
A custom class represents the altimeter signal processor for this example. Now that all required inputs have been generated, create the altimeterSignalProcessor. The concept of this signal processor is discussed more in a later section.
altimeterSignalProcessor = helperAltimeterSignalProcessor(upsweepWaveformSamples,downsweepWaveformSamples,sweepSlope,waveformSamplingRate,receiverSamplingRate)
altimeterSignalProcessor =
  helperAltimeterSignalProcessor with properties:

      UpsweepReference: [524476×1 double]
    DownsweepReference: [524476×1 double]
              Detector: [1×1 phased.CFARDetector]
         RangeResponse: [1×1 phased.RangeResponse]
Create Radar Scenario with a Land Surface
The simulation of the altimeter model is composed of an altimeter mounted on a platform with a flight trajectory over a land surface. The first part of the scenario setup is creating a LandSurface from imported elevation data. This elevation data was generated from a Digital Terrain Elevation Data (DTED) file that contains real world terrain data from Chicago O'Hare Airport. For more information on generating surface clutter signals using real terrain data, see Introduction to Radar Scenario Clutter Simulation.
Initialize the Radar Scenario
Initialize the radarScenario before adding a LandSurface and ClutterGenerator. tStart and tStop refer to the start and stop time for the trajectory. tUpdate controls the size of the time step used by the simulation. This value is set to 5 seconds instead of the default update rate to speed up the simulation. The default update rate if unset would be the PRF of the radar.
tStart = 300;     % Simulated trajectory start (s)
tStop = 395;      % Simulated trajectory stop (s)
tUpdate = 5;      % Simulated trajectory update interval (s)

scene = radarScenario('StopTime',tStop-tStart,'UpdateRate',1/tUpdate,'IsEarthCentered',true);
Generate the Surface and Clutter
Elevation data is loaded to generate the surface in the boundary of interest. The reflectivity of the land is created using an APL model that supports a 90 degree grazing angle in an urban environment. The coordinates of the flight trajectory are used to choose the boundaries of the surface. A LandSurface and ClutterGenerator are added to the radarScenario to generate IQ data of the ground reflection as the simulation progresses.
load('surfaceHeightData.mat','surfaceHeight')                          % Load surface elevation data
refl = surfaceReflectivity('Land','Model','APL','LandType','Urban');   % Land reflectivity model
boundaryLatLim = [41.9799   41.9879];                                  % Set the boundary latitude limits (deg)
boundaryLonLim = [-87.9000  -87.7750];                                 % Set the boundary longitude limits (deg)

% Create the land surface and clutter generator
surface = landSurface(scene,'Terrain',surfaceHeight.','Boundary',[boundaryLatLim; boundaryLonLim],'RadarReflectivity',refl);

clutter = clutterGenerator(scene,altimeterTransceiver);
Landing Scenario Simulation
Altimeter performance requirements vary as a function of altitude and altimeters must continue to provide accurate altitude information as the aircraft roll angle changes. To verify that the altimeter meets these requirements, a landing scenario and a banking scenario are simulated. The landing scenario is discussed first followed by the banking scenario.
Generate Flight Trajectory
The landing scenario uses a real flight trajectory of an aircraft approaching Chicago O'Hare Airport. The last step in setting up the simulation is adding a platform to the radarScenario with the altimeter radarTransceiver as a sensor and a trajectory using the landing trajectory.
flightTrajectoryFile = 'ORD_FlightTraj.mat';
landingFlightTrajectory = helperGetFlightTrajectory(surface,flightTrajectoryFile,tStart,tStop,tUpdate);
altimeterPlatform = platform(scene,'Sensors',altimeterTransceiver,'Trajectory',landingFlightTrajectory,'Dimensions',struct('Length',.00075,'Width',20,'Height',.007,'OriginOffset',[0 0 0]));
The animations below visualize the landing scenario. Execute the following line of code to generate the animations.
helperAltimeterGlobeAnimation(altimeterTransceiver,tStop,tStart,tUpdate,boundaryLatLim,boundaryLonLim,surfaceHeight,landingFlightTrajectory,'Landing')
Run Simulation
First set the random number generator seed for reproducible results and setup containers for storing data as the simulation proceeds.
rng('default');                                           % Set random number generator seed
nSimulationPoints = floor((tStop-tStart)/tUpdate)+1;      % Calculate the number of simulation points
landingRadarSignal = cell(1,nSimulationPoints);           % Store the raw radar signal
landingMeasuredAltitude = zeros(1,nSimulationPoints);     % Store measured altitude
landingTruthAltitude = zeros(1,nSimulationPoints);        % Store truth altitde
landingRollAngle = zeros(1,nSimulationPoints);            % Store the aircraft roll angle in degrees
cnt = 1;                                                  % Initialize count variable
With the variables set up, run the simulation calculating the measured altitude, true altitude, and roll angle at each step. The clutter resolution is set at each simulation step so that the density of clutter scatterers is sufficient. A higher scatterer density is required as the aircraft descends.
while advance(scene)

    % Calculate truth altitude
    [landingTruthAltitude(cnt), landingRollAngle(cnt)] = helperCalculateGroundTruth(surface,altimeterPlatform);

    % Calculate required clutter resolution and set accordingly
    clutter.Resolution = helperDetermineClutterResolution(landingTruthAltitude(cnt));

    % Receive the IQ and track aircraft position and simulation time
    iqsig = receive(scene);
    radarSignal = iqsig{:};

    % save the first step of iq data for later analysis
    if cnt == 1
        firstLandingSignal = radarSignal;
    end

    % Calculate measured and truth altitude
    landingMeasuredAltitude(cnt) = altimeterSignalProcessor.estimateAircraftAltitude(radarSignal);


    cnt = cnt + 1;
end

% Store the last signal for later analysis
lastLandingSignal = radarSignal;
Analyze Altimeter Signal Processor Ground Detection Algorithm
FMCW radars determine the range and velocity of a target by dechirping the received signal with the transmitted signal and measuring the beat frequency of the dechirped signal. For more information on using FMCW radars for target range estimation, see Automotive Adaptive Cruise Control Using FMCW Technology. This section discusses the altimeter signal processor functionality before looking at the overall performance of the altimeter during the landing scenario. The helperAltimeterSignalProcessor class contains the logic for the signal processor.
Use the data from the first step of the landing scenario simulation to analyze the ground detection algorithm.
trueAltitude = landingTruthAltitude(1); % Get the true altitude based on aircraft positionThe first step in the signal processing algorithm is dechirping the received signal by mixing it with the known transmitted signal. The frequency of the dechirped signal is directly proportional to the range of the target, in this case the ground. After the signal is dechirped, the signal processor converts frequency values to range values using the known sweep slope. This processing step is handled by the phased.RangeResponse object in the altimeterSignalProcesor. The following plot illustrates the range response for the upsweep and downsweep signals that is the magnitude of the received signal as a function of range.
plotStruct = struct('TrueAltitude',trueAltitude,'XLims',[trueAltitude-50 trueAltitude+50]);
altimeterSignalProcessor.plotRangeResponse(firstLandingSignal,plotStruct);
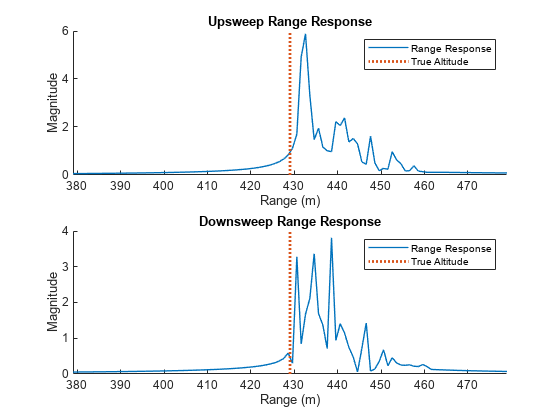
The plots above show that the returned energy from an altimeter at this altitude are spread over about 30 meters. This is expected because the target is the ground, which has a large RCS and the altimeter uses a large beamwidth.
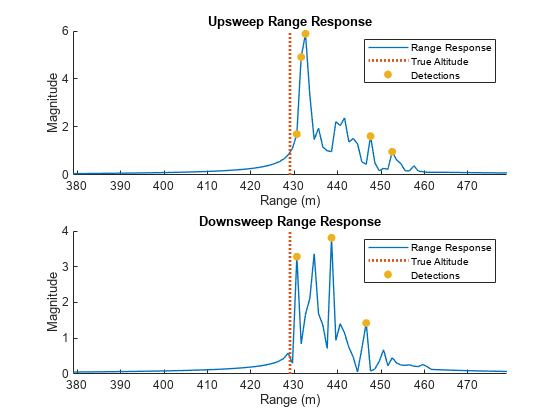
A CFAR algorithm is used to generate detections using the smallest of cell averaging technique to select for detections on the edge of the clutter return, as this is where the ground lies. The number of detections is limited by using a false alarm rate of 1e-7. The following plots show the range response of the signals in addition to the detections that the CFAR algorithm in the signal processor found.
plotStruct = struct('TrueAltitude',trueAltitude,'Detections',[],'XLims',[trueAltitude-50 trueAltitude+50]);
altimeterSignalProcessor.plotRangeResponse(firstLandingSignal,plotStruct);
Once the detection algorithm has been applied, the detection with the highest power is used to estimate the aircraft altitude. The following plot shows the ranges that are selected to estimate the altitude from the upsweep and downsweep signals.
plotStruct = struct('TrueAltitude',trueAltitude,'Detections',[],'SelectedRange',[],'XLims',[trueAltitude-50 trueAltitude+50]);
altimeterSignalProcessor.plotRangeResponse(firstLandingSignal,plotStruct);
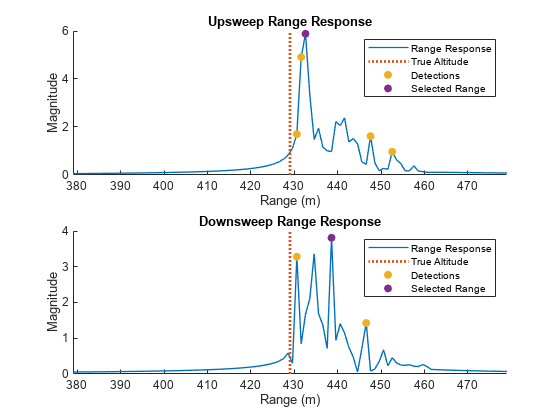
The effect of Doppler shift on the altitude estimate is removed by averaging the upsweep and downsweep altitude. The effectiveness of the altimeter algorithm can be checked by comparing the measured altitude to the ground truth altitude. For the first simulation step, the estimate is less than 5 meters from the true distance to the ground, which is an error of about 1%.
altitudeMeasured = altimeterSignalProcessor.estimateAircraftAltitude(firstLandingSignal);
fprintf('Measured Altitude = %0.1f m, True Altitude = %0.1f m, Altitude Error = %0.1f m',altitudeMeasured,trueAltitude,trueAltitude - altitudeMeasured);
Measured Altitude = 433.1 m, True Altitude = 429.0 m, Altitude Error = -4.1 m
Landing Scenario Performance
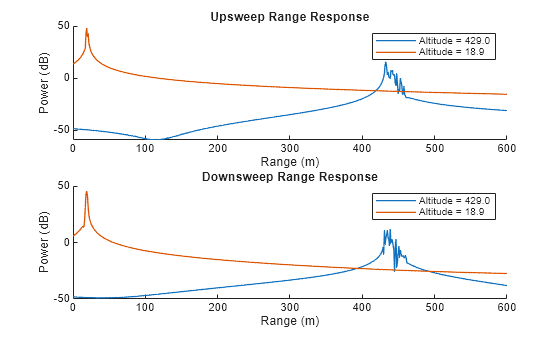
The landing scenario measures the ability of the altimeter model to continue to produce good results as the range spread and power level of the clutter return vary. At higher altitudes, the return occurs over a much wider range and lower power level than at lower altitudes.
The plot below shows the range response of the highest and lowest altitude data point. Notice the difference in power as well as the width of the range response. The landing scenario tests the ability of the altimeter to meet performance requirements as the returned signal varies dramatically in shape and power.
plotStruct = struct('XLims',[0 600],'LegendName', ['Altitude = ',num2str(landingTruthAltitude(1),'%.1f')],'PlotDb',[]);
[upaxis, downaxis] = altimeterSignalProcessor.plotRangeResponse(firstLandingSignal,plotStruct);
plotStruct = struct('XLims',[0 600],'LegendName', ['Altitude = ',num2str(landingTruthAltitude(end),'%.1f')],'UpDownAxis',[upaxis,downaxis],'PlotDb',[]);
altimeterSignalProcessor.plotRangeResponse(lastLandingSignal,plotStruct);
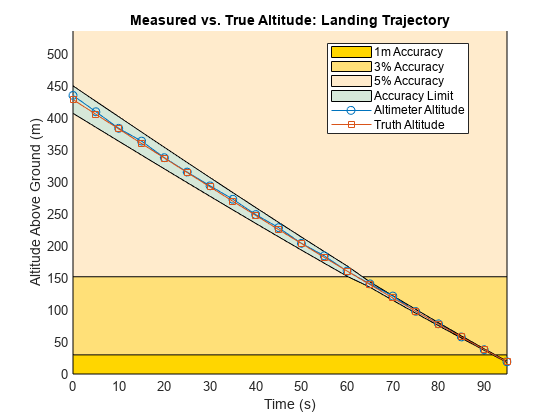
The following two plots visualize altimeter performance as the altitude of the aircraft changes. The first plot shows the altimeter altitude and true altitude throughout the duration of the landing scenario superimposed on top of the accuracy requirements derived from [1]. The second plot shows the altitude error throughout the landing scenario compared to the accuracy requirements derived from [1].
simTime = 0:tUpdate:(tStop-tStart);
helperPlotAltimeterAccuracy(landingTruthAltitude, landingMeasuredAltitude, simTime, 'Time (s)', 'Measured vs. True Altitude: Landing Trajectory')
helperPlotAltimeterError(landingTruthAltitude,landingMeasuredAltitude,landingTruthAltitude,'True Altitude (m)','Measurement Error: Landing Trajectory',true)
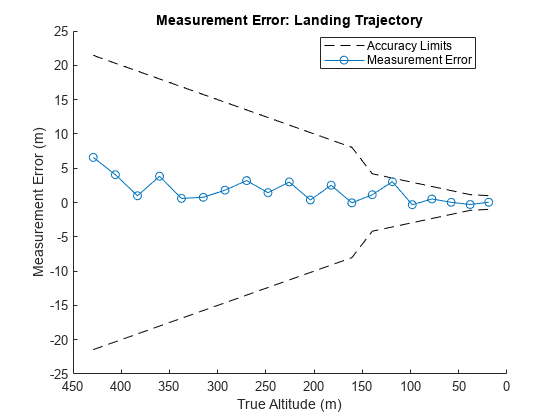
In general, the altimeter as modeled meets the performance requirements laid out in [1] for the landing scenario. The error appears to reduce as the aircraft altitude drops. This makes sense, because the beam footprint gets smaller as the aircraft altitude drops, so the clutter returns happen over a smaller area. Note that the performance indicates that the algorithm could be improved.
Banking Scenario Simulation
The radar altimeter must continue to meet performance requirements as the aircraft roll and pitch angles change. A scenario in which the aircraft roll angle varies is simulated to evaluate this capability.
Generate Flight Trajectory and Update Radar Scenario
A helper function generates the flight trajectory for the aircraft banking scenario by modifying the landing trajectory to have a constant altitude and a roll angle that varies between positive and negative 1/2 beamwidth of the antenna. In this scenario, the flight direction remains constant despite the variation in aircraft roll for the sake of simplicity.
bankingFlightTrajectory = helperGetFlightTrajectory(surface,flightTrajectoryFile,tStart,tStop,tUpdate,antBeamwidth / 2);
With the banking trajectory created, the scenario is restarted, and the flight trajectory of the platform is updated to use the banking trajectory instead of the landing trajectory.
altimeterPlatform.Trajectory = bankingFlightTrajectory;
The following animations visualize the banking scenario. Execute the following line of code to generate the animations.
helperAltimeterGlobeAnimation(altimeterTransceiver,tStop,tStart,10,boundaryLatLim,boundaryLonLim,surfaceHeight,bankingFlightTrajectory,'Banking')

Run Simulation
Run the simulation now that the platform in the scenario follows a banking flight trajectory. In this case a helper function runs the simulation because the exact same block of code was used to simulate the landing scenario.
signalToSave = [1 ceil(nSimulationPoints/2)];     % Save the first radar signal and the middle radar signal for later analysis
[bankingMeasuredAltitude,bankingTruthAltitude,bankingRollAngle,bankingRadarSignal,maxErrorSignal,maxErrorIdx] = helperSimulateAltimeterScenario(scene,nSimulationPoints,altimeterSignalProcessor,surface,clutter,signalToSave);
Banking Scenario Performance
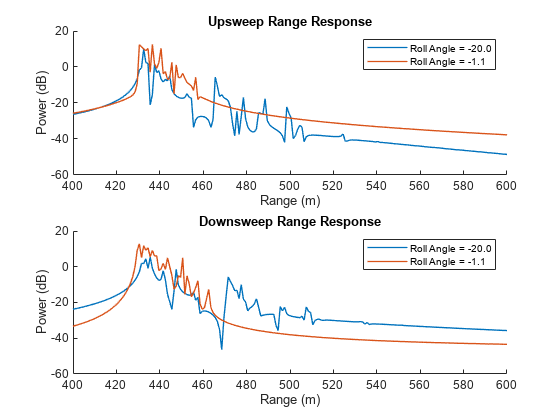
The banking scenario measures the ability of the altimeter model to continue to produce good results as the shape of the clutter return changes due to aircraft roll angle. When the aircraft has a high roll angle, the nadir is at the edge of the beam footprint and the beam footprint covers a greater area. When the aircraft has a low roll angle, the nadir is in the center of the beam footprint and the beam footprint covers a smaller area.
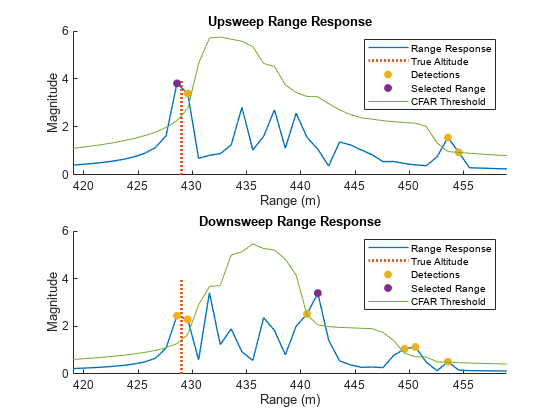
The following plots show the range response when the roll angle of the aircraft is at its highest (20 degrees) vs. lowest (1 degree). Notice that when the roll angle is lower, the maximum range response power is greater, and the spread of ranges is more narrow compared to the highest roll angle case.
plotStruct = struct('XLims',[400 600],'LegendName', ['Roll Angle = ',num2str(bankingRollAngle(1),'%.1f')],'PlotDb',[]);
[upaxis, downaxis] = altimeterSignalProcessor.plotRangeResponse(bankingRadarSignal{1},plotStruct);
plotStruct = struct('XLims',[400 600],'LegendName', ['Roll Angle = ',num2str(bankingRollAngle(ceil(nSimulationPoints/2)),'%.1f')],'UpDownAxis',[upaxis,downaxis],'PlotDb',[]);
altimeterSignalProcessor.plotRangeResponse(bankingRadarSignal{end},plotStruct);
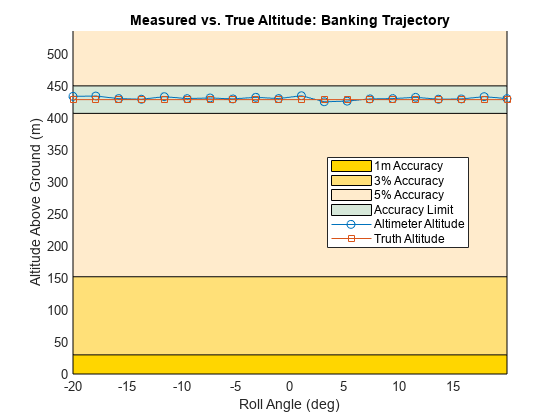
The following two plots visualize altimeter performance as the roll angle of the aircraft changes. Once again plot the measured and true altitude on the same graph along with the acceptable error limits for altimeters derived from [1]. Additionally, plot the measurement error along with the acceptable error limits. Roll angle is the independent variable in this case.
helperPlotAltimeterAccuracy(bankingTruthAltitude, bankingMeasuredAltitude, bankingRollAngle, 'Roll Angle (deg)', 'Measured vs. True Altitude: Banking Trajectory');
helperPlotAltimeterError(bankingTruthAltitude,bankingMeasuredAltitude,bankingRollAngle,'Roll Angle (deg)','Measurement Error: Banking Trajectory',false);
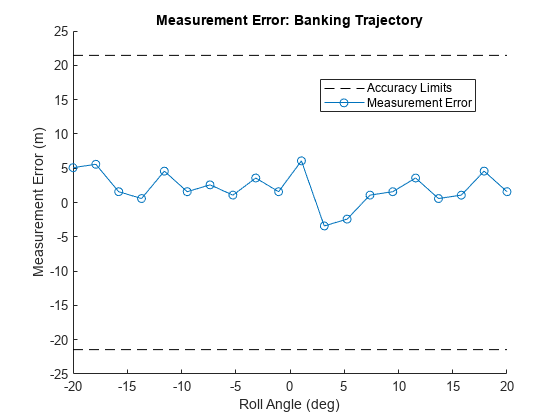
The performance of the altimeter in the banking scenario meets the requirements described in [1] as aircraft rolls and the shape of the signal return changes. There are a couple of points that appear to be outliers in terms of error magnitude, which are discussed in the next section.
Results Discussion
In general, the altimeter meets the performance requirements described in [1] in the simulations of the landing and banking scenarios. In both cases, there are points with particularly high measurement errors, suggesting that improvements could still be made to this altimeter design.
As discussed, the ground is detected using a smallest of cell averaging CFAR algorithm to select for points on the edge of the clutter return. The highest power detection is used to estimate the aircraft altitude. The larger errors occur when the selected detection is not made on the leading edge of the clutter return. The following plot shows the clutter return with detections in addition to the CFAR threshold from the point with the largest error in the banking scenario.
maxErrorAltitude = bankingTruthAltitude(maxErrorIdx);                         % Return signal for the maximum measurement error point

% Plot the detections for the maximum measurement error point in the
% landing scenario
plotStruct = struct('TrueAltitude',maxErrorAltitude,'SelectedRange',[],'Detections',[],'Threshold',[],'XLims',[maxErrorAltitude-10 maxErrorAltitude+30]);
altimeterSignalProcessor.plotRangeResponse(maxErrorSignal,plotStruct);
In the plot above, there is a higher power detection that occurs on the trailing edge of the clutter return. This leads to a relatively high measurement error. A similar pattern is seen in other points with large errors This suggests that some further improvements could be made to the altimeter design by fine-tuning the ground detection algorithm.
Summary
This example models a simple radar altimeter and uses surface clutter as a target to determine aircraft altitude. The example starts by building the radar altimeter mode from a transceiver that generates IQ data and a signal processor that generates the ground range estimate from the IQ data. Then, two radar scenarios are simulated and performance of the altimeter is measured in both scenarios.
References
[1] Operational and Technical Characteristics and Protection Criteria of Radio Altimeters Utilizing the Band 4200-4400 MHz. Recommendation, M.2059-0, ITU-R, Feb. 2014, https://www.itu.int/dms_pubrec/itu-r/rec/m/R-REC-M.2059-0-201402-I!!PDF-E.pdf.
Supporting Functions
The helperAltimeterSignalProcessor class is shown below.
type('helperAltimeterSignalProcessor.m')classdef helperAltimeterSignalProcessor
% This class is used in the Altimeter Simulation example to perform the
% signal processing for the radar altimeter.
properties
UpsweepReference
DownsweepReference
Detector
RangeResponse
end
methods
function obj = helperAltimeterSignalProcessor(refSigUp,refSigDown,sweepSlope,fsWaveform,fsReceiver)
obj.UpsweepReference = refSigUp;
obj.DownsweepReference = refSigDown;
decimationFactor = floor(fsWaveform / fsReceiver);
obj.Detector = phased.CFARDetector('Method','SOCA','NumTrainingCells',50,'NumGuardCells',2,'ProbabilityFalseAlarm',1e-7,"ThresholdOutputPort",true);
obj.RangeResponse = phased.RangeResponse("RangeMethod","FFT",...
"SampleRate",fsWaveform,"SweepSlope",sweepSlope,"DechirpInput",true,"DecimationFactor",decimationFactor);
end
function [altitude,rngup,rngdn,respup,respdn] = estimateAircraftAltitude(obj,radarSignal)
% Apply CFAR detector to return signal
[grndrangesup,grndrangesdn,grndmagrespup,grndmagrespdn] = detectGround(obj,radarSignal);
% Find the maximum power detection for upsweep and downsweep
[rngup,respup] = findMaxMagResp(grndmagrespup,grndrangesup);
[rngdn,respdn] = findMaxMagResp(grndmagrespdn,grndrangesdn);
% Estimate altitude as average of up and down sweeps
if isempty(rngup)
rngup = -rngdn;
end
if isempty(rngdn)
rngdn = -rngup;
end
altitude = (-rngdn + rngup)/2;
function [rng,rngrspmax] = findMaxMagResp(rngrsp,fullrng)
[rngrspmax,rngidx] = max(abs(rngrsp));
rng = fullrng(rngidx);
end
end
function [grndrangesup,grndrangesdn,grndmagrespup,grndmagrespdn,range,upthreshold,downthreshold] = detectGround(obj,radarSignal)
% Get the range response of the radar signal
[rngrespup,rngrespdn,range] = obj.getRangeResponse(radarSignal);
% Detect ground ranges above threshold from upsweep
[upidx,upthreshold] = obj.Detector(abs(rngrespup).^2,1:length(rngrespup));
grndrangesup = range(upidx);
grndmagrespup = rngrespup(upidx);
% Detect ground ranges above threshold from downsweep
[dnidx,downthreshold] = obj.Detector(abs(rngrespdn).^2,1:length(rngrespdn));
grndrangesdn = range(dnidx);
grndmagrespdn = rngrespdn(dnidx);
% Take square root to get thresholds because thresholding done
% on squares
upthreshold = sqrt(upthreshold);
downthreshold = sqrt(downthreshold);
end
function [rngrespup,rngrespdn,range] = getRangeResponse(obj,radarSignal)
% Get the range response of the radar signal
[rngrespup,~] = obj.RangeResponse(radarSignal(:,1),obj.UpsweepReference);
[rngrespdn,range] = obj.RangeResponse(radarSignal(:,2),obj.DownsweepReference);
end
%------------------------------------------------------------------
% Visualization Functions
%------------------------------------------------------------------
function [upsweepSubplotAxis,downsweepSubplotAxis] = plotRangeResponse(obj,radarSignal,plotStruct)
% Plot the dechirped signals in the frequency domain.
[rangeResponseUpsweep,rangeResponseDownsweep,range] = obj.getRangeResponse(radarSignal);
if isfield(plotStruct,'UpDownAxis')
upsweepSubplotAxis = plotStruct.UpDownAxis(1);
downsweepSubplotAxis = plotStruct.UpDownAxis(2);
else
figure();
upsweepSubplotAxis = subplot(2,1,1);
downsweepSubplotAxis = subplot(2,1,2);
end
if isfield(plotStruct,'LegendName')
rangeResponseName = plotStruct.LegendName;
showLegend = true;
else
rangeResponseName = 'Range Response';
showLegend = false;
end
if isfield(plotStruct,'PlotDb')
rangeResponseUpsweepDb = 20*log10(abs(rangeResponseUpsweep));
rangeResponseDownsweepDb = 20*log10(abs(rangeResponseDownsweep));
plotRangeResponse(upsweepSubplotAxis,range,rangeResponseUpsweepDb,'Upsweep Range Response','Power (dB)',rangeResponseName,showLegend,[0 max(range)]);
plotRangeResponse(downsweepSubplotAxis,-range,rangeResponseDownsweepDb,'Downsweep Range Response','Power (dB)',rangeResponseName,showLegend,[0 max(-range)]);
else
plotRangeResponse(upsweepSubplotAxis,range,abs(rangeResponseUpsweep),'Upsweep Range Response','Magnitude',rangeResponseName,showLegend,[0 max(range)]);
plotRangeResponse(downsweepSubplotAxis,-range,abs(rangeResponseDownsweep),'Downsweep Range Response','Magnitude',rangeResponseName,showLegend,[0 max(-range)]);
end
if isfield(plotStruct,'TrueAltitude')
truthAltitude = plotStruct.TrueAltitude;
obj.plotTruthAltitude(truthAltitude,upsweepSubplotAxis,downsweepSubplotAxis);
end
if isfield(plotStruct,'Detections')
obj.plotDetections(radarSignal,upsweepSubplotAxis,downsweepSubplotAxis);
end
if isfield(plotStruct,'SelectedRange')
obj.plotSelectedRange(radarSignal,upsweepSubplotAxis,downsweepSubplotAxis);
end
if isfield(plotStruct,'Threshold')
obj.plotThreshold(radarSignal,upsweepSubplotAxis,downsweepSubplotAxis);
end
if isfield(plotStruct,'XLims')
xlim(upsweepSubplotAxis,plotStruct.XLims)
xlim(downsweepSubplotAxis,plotStruct.XLims)
end
function plotRangeResponse(axis,range,mResponse,plotTitle,yLabel,rangeResponseName,showLegend,plotLims)
hold(axis,"on")
plot(axis,range,mResponse,'DisplayName',rangeResponseName,'LineWidth',1);
title(axis,plotTitle);
ylabel(axis,yLabel);
xlabel(axis,'Range (m)');
xlim(axis,plotLims);
if showLegend
legend(axis,'Location','northeast');
end
hold(axis,"off")
end
end
function [upsweepSubplotAxis,downsweepSubplotAxis] = plotTruthAltitude(~,truthAltitude,upsweepSubplotAxis,downsweepSubplotAxis)
% This function plots the truth altitude on top of the
% range response
plotTruthAltitude(upsweepSubplotAxis,truthAltitude);
plotTruthAltitude(downsweepSubplotAxis,truthAltitude);
function plotTruthAltitude(axis,truthFrequency)
hold(axis,"on")
ylimit = axis.YLim;
x = [truthFrequency truthFrequency];
y = ylimit;
plot(axis,x,y,':','DisplayName','True Altitude','LineWidth',2);
legend(axis,'Location','northeast');
hold(axis,"off")
end
end
function [upsweepSubplotAxis,downsweepSubplotAxis] = plotDetections(obj,radarSignal,upsweepSubplotAxis,downsweepSubplotAxis)
% Plot the CFAR detections on the axis provided
[rDetectionsUpsweep,rDetectionsDownsweep,mDetectionsUpsweep,mDetectionsDownsweep] = obj.detectGround(radarSignal);
plotDetections(obj,upsweepSubplotAxis,rDetectionsUpsweep,mDetectionsUpsweep);
plotDetections(obj,downsweepSubplotAxis,-rDetectionsDownsweep,mDetectionsDownsweep);
function plotDetections(obj,axis,rDetection,mDetection)
obj.plotScatterOnAxis(axis,rDetection,abs(mDetection),'Detections');
end
end
function [upsweepSubplotAxis,downsweepSubplotAxis] = plotThreshold(obj,radarSignal,upsweepSubplotAxis,downsweepSubplotAxis)
% Plot the CFAR threshold on the axis provided
[~,~,~,~,range,upthreshold,downthreshold] = obj.detectGround(radarSignal);
plotThresholdOnAxis(upsweepSubplotAxis,range,upthreshold);
plotThresholdOnAxis(downsweepSubplotAxis,-range,downthreshold);
function plotThresholdOnAxis(axis,range,threshold)
hold(axis,"on");
plot(axis,range,threshold,'DisplayName','CFAR Threshold');
legend(axis,'Location','northeast');
hold(axis,"off");
end
end
function [upsweepSubplotAxis,downsweepSubplotAxis] = plotSelectedRange(obj,radarSignal,upsweepSubplotAxis,downsweepSubplotAxis)
% Plot the selected range on the axis provided
[~,rSelectedUpsweep,rSelectedDownsweep,mSelectedUpsweep,mSelectedDownsweep] = obj.estimateAircraftAltitude(radarSignal);
plotSelectedRange(obj,upsweepSubplotAxis,rSelectedUpsweep,mSelectedUpsweep);
plotSelectedRange(obj,downsweepSubplotAxis,-rSelectedDownsweep,mSelectedDownsweep);
function plotSelectedRange(obj,axis,fSelected,mSelected)
obj.plotScatterOnAxis(axis,fSelected,abs(mSelected),'Selected Range');
end
end
function plotScatterOnAxis(~,axis,xdata,ydata,name)
% Plot a scatter plot on an existing axis without modifying the
% axis.
hold(axis,"on");
scatter(axis,xdata,ydata,'filled','DisplayName',name);
legend(axis,'Location','northeast');
hold(axis,'off')
end
end
end
Various other functions defined below are used throughout this example.
function [TruthAltitude, RollAngle] = helperCalculateGroundTruth(surface,platform)
% Calculate the actual altitude and aircraft roll angle based on current aircraft position

% Terrain elevation height at the current aircraft position
ElevationHeight = surface.height([platform.Position(1);platform.Position(2)]);

% Ground truth altitude
TruthAltitude = platform.Position(3) - ElevationHeight;

% Roll angle
RollAngle = platform.Orientation(2);
end

function flightTrajectory =  helperGetFlightTrajectory(surface,FlightTrajectoryFile,n1,n2,updateInterval,varargin)
% Return a flight trajectory with elevation from trajectory data file

% Load flight trajectory
load(FlightTrajectoryFile,'flightTrajectory');

% Init arrival time
ArrivalTime = 0:size(flightTrajectory,1)-1;

% Add the ground elevation to flight elevation
flightTrajectory = flightTrajectory(n1:updateInterval:n2,:);
groundElevation = surface.height(flightTrajectory(:,1:2)')';
flightTrajectory(:,3) = flightTrajectory(:,3) + groundElevation;

% Generate the flight trajectory
ArrivalTime = ArrivalTime(n1:updateInterval:n2)-ArrivalTime(n1);
stepNumber = numel(ArrivalTime);
orientationEuler = zeros(stepNumber,3);

% If provided, generate a fixed altitude trajectory with bank angle
if nargin > 5
    bankAngle = varargin{1};
    allBankAngles = -bankAngle:2*bankAngle/(stepNumber-1):bankAngle;
    orientationEuler(:,2) = allBankAngles;
    orientationQuat = quaternion(orientationEuler,'rotvecd');
    flightTrajectory(:,3) = flightTrajectory(:,3) - groundElevation;
    flightTrajectory(:,3) = flightTrajectory(1,3);
    flightTrajectory(:,3) = flightTrajectory(:,3) + groundElevation;
    flightTrajectory = geoTrajectory(flightTrajectory,ArrivalTime,'Orientation',orientationQuat);
else
    orientationQuat = quaternion(orientationEuler,'rotvecd');
    flightTrajectory = geoTrajectory(flightTrajectory,ArrivalTime,'Orientation',orientationQuat);
end

end

function [MeasuredAltitude,TruthAltitude,RollAngle,RadarSignal,MaxErrorSignal,MaxErrorIdx] = helperSimulateAltimeterScenario(scene,nSimulationPoints,altimeterSignalProcessor,surface,clutter,radarSignalPoints)
% Simulate the scenario and return key metrics

% Setup scene
rng(1);
restart(scene);

% Initialize variables
RadarSignal = cell(1,length(radarSignalPoints));
MeasuredAltitude = zeros(1,nSimulationPoints);
TruthAltitude = zeros(1,nSimulationPoints);
RollAngle = zeros(1,nSimulationPoints);
maxMeasurementError = -Inf;
cnt = 1;

% Run the simulation
while advance(scene)

    % Calculate truth altitude
    [TruthAltitude(cnt), RollAngle(cnt)] = helperCalculateGroundTruth(surface,scene.Platforms{1});

    % Calculate required clutter resolution and set accordingly
    clutter.Resolution = helperDetermineClutterResolution(TruthAltitude(cnt));

    % Receive the iq and track aircraft position and simulation time
    iqsig = receive(scene);
    radarSignal = iqsig{:};

    % Calculate measured altitude
    MeasuredAltitude(cnt) = altimeterSignalProcessor.estimateAircraftAltitude(radarSignal);
    measurementError = abs(MeasuredAltitude(cnt)-TruthAltitude(cnt));

    if (measurementError > maxMeasurementError)
        maxMeasurementError = measurementError;
        MaxErrorSignal = radarSignal;
        MaxErrorIdx = cnt;
    end

    if any(radarSignalPoints == cnt)
        RadarSignal{radarSignalPoints == cnt} = radarSignal;
    end

    cnt = cnt + 1;
end

end

function helperPlotAltimeterAccuracy(TruthAltitude,MeasuredAltitude,xValues,xAxisName,chartTitle)
% Plot the actual altimeter accuracy compared to the required accuracy

% Get the accuracy limits for each truth altitude
accuracyLimits = helperGetAccuracyLimits(TruthAltitude);

% Determine whether any of the measured altitudes were too high or too low
measureErrorLow = MeasuredAltitude < accuracyLimits.lowerLimit;
measureErrorHigh = MeasuredAltitude > accuracyLimits.upperLimit;
measureErrorIdx = measureErrorLow | measureErrorHigh;

figure; hold on;

% Plot the accuracy limits
plotAllAccuracyLimits(xValues,accuracyLimits)

plot(xValues,MeasuredAltitude,'-o','DisplayName','Altimeter Altitude', ...
    'color',[0 0.45 0.74])
plot(xValues,TruthAltitude,'-s','DisplayName','Truth Altitude', ...
    'color',[0.85 0.33 0.1])
plot(xValues(measureErrorIdx),MeasuredAltitude(measureErrorIdx),'x','MarkerSize',10, ...
    'linewidth',2,'Color','red','DisplayName','Out of Accuracy Lim.');
ylabel('Altitude Above Ground (m)'); xlabel(xAxisName)
title(chartTitle)
legend('Location','best'); grid on; box on;
xlim([min(xValues) max(xValues)])
ylim([0 max(TruthAltitude)*1.25])

function plotAllAccuracyLimits(xValues,accuracyLimits)

    % From 0 to 30 m, 1 m of accuracy
    curve1 = zeros(size(xValues));
    curve2 = zeros(size(xValues)) + 30;
    helperPlotAccuracyLimitsSurface(xValues, curve1, curve2, [1 0.84 0],'1m Accuracy')

    % From 30 to 152 m, 3% accuracy
    curve1 = zeros(size(xValues)) + 30;
    curve2 = zeros(size(xValues)) + 152;
    helperPlotAccuracyLimitsSurface(xValues, curve1, curve2, [1 0.88 .47],'3% Accuracy')

    % From 152 to 762 m, 5% accuracy
    curve1 = zeros(size(xValues)) + 152;
    curve2 = zeros(size(xValues)) + 762;
    helperPlotAccuracyLimitsSurface(xValues, curve1, curve2, [1 0.92 0.8],'5% Accuracy')

    % Accuracy limit for the flight
    curve1 = accuracyLimits.lowerLimit(1:end);
    curve2 = accuracyLimits.upperLimit(1:end);
    helperPlotAccuracyLimitsSurface(xValues,curve1, curve2,[0.84 0.91 0.85],'Accuracy Limit')
end

end

function helperPlotAltimeterError(TruthAltitude,MeasuredAltitude,xValues,xAxisName,chartTitle,reverseAxis)
% Plot the altimeter error

% Get the accuracy limits for each truth altitude
accuracyLimits = helperGetAccuracyLimits(TruthAltitude);
normalizedLimits.lowerLimit = accuracyLimits.lowerLimit - TruthAltitude;
normalizedLimits.upperLimit = accuracyLimits.upperLimit - TruthAltitude;

% Get the measurement error
measurementError = MeasuredAltitude - TruthAltitude;

figure; hold on;

% Accuracy limit for the flight
curve1 = normalizedLimits.lowerLimit;
curve2 = normalizedLimits.upperLimit;

lLower = plot(xValues,curve1,'--','DisplayName','Accuracy Limits','Color','k');
plot(xValues,curve2,'--','DisplayName','Accuracy Limits','Color','k');
lPlot = plot(xValues,measurementError,'-o','DisplayName','Measurement Error', 'color',[0 0.45 0.74]);

ylabel('Measurement Error (m)'); xlabel(xAxisName)
title(chartTitle)
legend([lLower,lPlot],'Location','best');

if reverseAxis
    set(gca, 'XDir','reverse')
end

end

function accuracy = helperGetAccuracyLimits(altitude)
%% Get the accuracy requirements for each altitude in the altitude
% vector based on the ITU document

accuracy.lowerLimit = zeros(size(altitude));
accuracy.upperLimit = zeros(size(altitude));

% 0 to 100 ft. <= +- 1m
idx = altitude < 30;
accuracy.lowerLimit(idx) = altitude(idx) - 1;
accuracy.upperLimit(idx) = altitude(idx) + 1;

% 100 to 500 ft. <= 3%
idx = and((altitude >= 30) , (altitude < 152));
accuracy.lowerLimit(idx) = altitude(idx) - 0.03*altitude(idx);
accuracy.upperLimit(idx) = altitude(idx) + 0.03*altitude(idx);

% 500 to 2500 ft. <= 5%
idx = and((altitude >= 152), (altitude < 762));
accuracy.lowerLimit(idx>0) = altitude(idx) - 0.05*altitude(idx);
accuracy.upperLimit(idx>0) = altitude(idx) + 0.05*altitude(idx);

% above 2500 --> No limit (let's assume 10%)
idx = ((altitude >= 762));
accuracy.lowerLimit(idx>0) = altitude(idx) - 0.1*altitude(idx);
accuracy.upperLimit(idx>0) = altitude(idx) + 0.1*altitude(idx);

end

function error = helperGetAllowedError(altitude)
    limits = helperGetAccuracyLimits(altitude);
    error = limits.upperLimit - mean([limits.upperLimit,limits.lowerLimit]);
end

function helperPlotAccuracyLimitsSurface(x,curve1, curve2, color,name)
% Plot an accuracy limit surface

x2 = [x, fliplr(x)];
inBetween = [curve1, fliplr(curve2)];
fill(x2, inBetween,color,'DisplayName',name);

end

function clutterResolution = helperDetermineClutterResolution(altitude)
% Set the resolution so that the density of scatters is high enough to
% obtain sufficient results. This is set such that ~4 scatters fall within
% the required system resolution.

requiredResolution = helperGetAllowedError(altitude);
longerRange = altitude + requiredResolution;
clutterCircleRadiusSq = (longerRange)^2-altitude^2;
clutterCircleArea = clutterCircleRadiusSq*pi;
numScatterers = 4;
clutterResolution = sqrt(clutterCircleArea/numScatterers);

end