plotTrajectory
Description
plotTrajectory(
plots trajectories specified by trajPlotter,trajCoordList)trajCoordList via the trajectory
plotter on a theater plot.
Examples
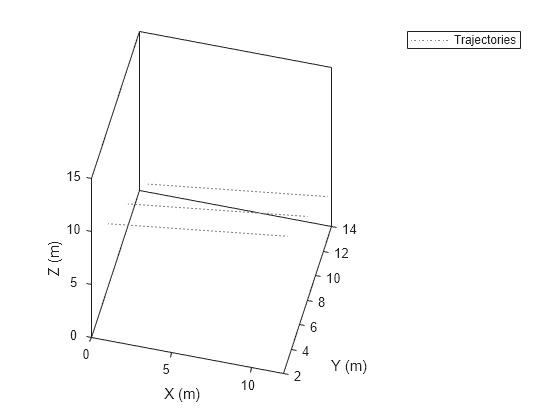
Define the coordinates for three trajectories.
coordinates1 = [(1:10)' (2:11)' (11:-1:2)'];
coordinates2 = coordinates1 + 1;
coordinates3 = coordinates1 + 2;
Create a theaterPlot object, set the view angles, and create a trajectoryPlotter object.
tp = theaterPlot;
view(14,50)
trajPlotter = trajectoryPlotter(tp,DisplayName="Trajectories");
Plot the three trajectories.
plotTrajectory(trajPlotter,{coordinates1,coordinates2,coordinates3})
This example shows how to create an animation of a platform moving on a trajectory.
First, create a radarScenario and add waypoints for a trajectory.
ts = radarScenario;
height = 100;
d = 1;
wayPoints = [ ...
    -30   -25   height;
    -30    25-d height;
    -30+d  25   height;
    -10-d  25   height;
    -10    25-d height;
    -10   -25+d height;
    -10+d -25   height;
    10-d -25   height;
    10   -25+d height;
    10    25-d height;
    10+d  25   height;
    30-d  25   height;
    30    25-d height;
    30   -25+d height;
    30   -25   height];
Specify a time for each waypoint.
elapsedTime = linspace(0,10,size(wayPoints,1));
Next, create a platform in the tracking scenario and add trajectory information using the trajectory method.
target = platform(ts);
traj = waypointTrajectory('Waypoints',wayPoints,'TimeOfArrival',elapsedTime);
target.Trajectory = traj;
Record the tracking scenario to retrieve the platform's trajectory.
r = record(ts);
pposes = [r(:).Poses];
pposition = vertcat(pposes.Position);
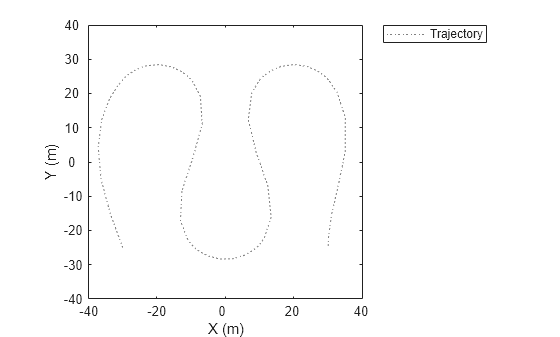
Create a theater plot to display the recorded trajectory.
tp = theaterPlot('XLim',[-40 40],'YLim',[-40 40]);
trajPlotter = trajectoryPlotter(tp,'DisplayName','Trajectory');
plotTrajectory(trajPlotter,{pposition})

Animate using the platformPlotter.
restart(ts);
trajPlotter = platformPlotter(tp,'DisplayName','Platform');

while advance(ts)
    p = pose(target,'true');
    plotPlatform(trajPlotter, p.Position);
    pause(0.1)

end

This animation loops through all the generated plots.

Input Arguments
Trajectory plotter, specified as a trajectoryPlotter
object.
Coordinates of the trajectories to show, specified as an N-element cell array, where N is the number of trajectories. Each cell element, representing a trajectory, contains an M-by-3 matrices, where M is the number of points in the trajectory. The matrices in different cells can have a different number of rows. The first, second, and third columns of each matrix correspond to the x-, y-, and z-coordinates of the corresponding trajectory.
Example: coordList = {[1 2 3; 4 5 6; 7,8,9];[4 2 1; 4 3 1];[4 4 4; 3 1 2; 9
9 9; 1 0 2]} specifies three different trajectories.
Version History
Introduced in R2021a
See Also
trajectoryPlotter | theaterPlot | clearData | clearPlotterData
MATLAB Command
You clicked a link that corresponds to this MATLAB command:
Run the command by entering it in the MATLAB Command Window. Web browsers do not support MATLAB commands.
Web サイトの選択
Web サイトを選択すると、翻訳されたコンテンツにアクセスし、地域のイベントやサービスを確認できます。現在の位置情報に基づき、次のサイトの選択を推奨します:
また、以下のリストから Web サイトを選択することもできます。
最適なサイトパフォーマンスの取得方法
中国のサイト (中国語または英語) を選択することで、最適なサイトパフォーマンスが得られます。その他の国の MathWorks のサイトは、お客様の地域からのアクセスが最適化されていません。
南北アメリカ
- América Latina (Español)
- Canada (English)
- United States (English)
ヨーロッパ
- Belgium (English)
- Denmark (English)
- Deutschland (Deutsch)
- España (Español)
- Finland (English)
- France (Français)
- Ireland (English)
- Italia (Italiano)
- Luxembourg (English)
- Netherlands (English)
- Norway (English)
- Österreich (Deutsch)
- Portugal (English)
- Sweden (English)
- Switzerland
- United Kingdom (English)