plotSurface
Description
Examples
Create a radar scenario.
scenario = radarScenario;
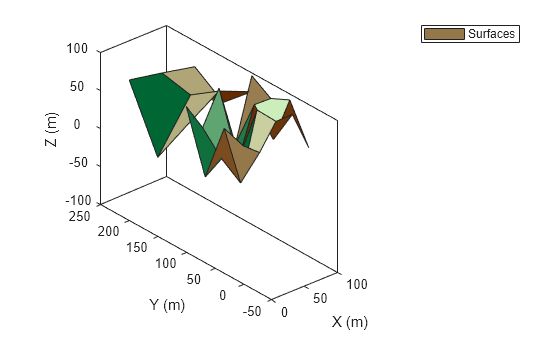
Define the terrain and boundaries of two surfaces and add the two surfaces to the radar scenario.
terrain1 = randi(100,4,5);
terrain2 = randi(100,3,3);
boundary1 = [0 100;
    0 100-eps];
boundary2 = [0 100;
    100 200];
s1 = landSurface(scenario,Terrain=terrain1,Boundary=boundary1);
s2 = landSurface(scenario,Terrain=terrain2,Boundary=boundary2);
Obtain the plotter data by using the surfacePlotterData function.
plotterData = surfacePlotterData(scenario.SurfaceManager)
plotterData=1×2 struct array with fields:
    X
    Y
    Z
    C
Create a theaterPlot object and specify the axis limits of the plot.
theaterpplot = theaterPlot(XLimits=[0 100],YLimits=[-50 250],ZLimits=[-100 100]);
Create a surface plotter.
plotter = surfacePlotter(theaterpplot,DisplayName="Surfaces");Plot surfaces in the theater plot. Change view angles for better visualization.
plotSurface(plotter,plotterData)
view(-41,29)

Input Arguments
Surface plotter object, created by the surfacePlotter function.
Plot data, specified as an S-element array of structures, where
S is the number of surfaces. You can directly create this argument
by using the surfacePlotterData function. To create this argument manually, specify
each structure with these fields.
| Field Name | Description |
|---|---|
X | Domain of the surface in the x-direction, specified as an M-element real-valued vector. M is the number of x-coordinates for defining the terrain of the surface. The values for the elements in the vector must monotonically increase. |
Y | Domain of the surface in the y-direction, specified as an N-element real-valued vector. N is the number of y-coordinates for defining the terrain of the surface. The values for the elements in the vector must monotonically increase. |
Z | Height values of the surface, specified as an
N-by-M real-valued matrix.
N is the number of elements in the Y
field, and M is the number of elements in the
X field. |
C | Color for vertices in the terrain of the surface, specified as an
N-by-M-by-3 matrix of RGB triplets.
N is the number of elements in the Y
field, and M is the number of elements in the
X field. The plotSurface function
determines the color of a surface patch based on the color of its first
vertex. |
Version History
Introduced in R2022b
See Also
surfacePlotterData | surfacePlotter | theaterPlot | SurfaceManager
MATLAB Command
You clicked a link that corresponds to this MATLAB command:
Run the command by entering it in the MATLAB Command Window. Web browsers do not support MATLAB commands.
Web サイトの選択
Web サイトを選択すると、翻訳されたコンテンツにアクセスし、地域のイベントやサービスを確認できます。現在の位置情報に基づき、次のサイトの選択を推奨します:
また、以下のリストから Web サイトを選択することもできます。
最適なサイトパフォーマンスの取得方法
中国のサイト (中国語または英語) を選択することで、最適なサイトパフォーマンスが得られます。その他の国の MathWorks のサイトは、お客様の地域からのアクセスが最適化されていません。
南北アメリカ
- América Latina (Español)
- Canada (English)
- United States (English)
ヨーロッパ
- Belgium (English)
- Denmark (English)
- Deutschland (Deutsch)
- España (Español)
- Finland (English)
- France (Français)
- Ireland (English)
- Italia (Italiano)
- Luxembourg (English)
- Netherlands (English)
- Norway (English)
- Österreich (Deutsch)
- Portugal (English)
- Sweden (English)
- Switzerland
- United Kingdom (English)